Build Your Own Analytics
& Debug It Like a Pro
Cookie-free. Privacy-respecting. Ad-blocker-proof. 16 dimensions, 26 dashboard queries, drill-down filtering, org identification, reading completion tracking, CSV export, dark mode — and the Chrome DevTools debugging story when nothing worked.
Your Website, Your Data
Build a privacy-respecting analytics system you fully own — no Google, no cookies, no third-party scripts phoning home.
Every time someone visits your website, a silent transaction occurs. Their browser whispers a wealth of information — where they came from, what device they carry, which city they sit in, what language they speak. Most developers surrender this data to Google Analytics without a second thought. A free tool. A simple script tag. Done.
But "free" has a price. Google owns that data. They use it for ad targeting. Your visitors get tracked across the web. You need cookie consent banners. And increasingly, ad blockers strip Google Analytics entirely — meaning you lose 30-40% of your traffic data.
What if you could capture every dimension — geo, device, browser, referrer, screen size — without cookies, without Google, without consent banners? What if the dashboard lived on your own website, protected by your own password, with data stored in your own database?
That is exactly what we built. And this is exactly how you can too.
Four Components. Zero Cookies.
The entire system has four pieces, each doing one job brilliantly:
The Tracker (ps.js) — A 1KB script on every page. Uses sendBeacon to fire a non-blocking POST with page path, referrer, screen size, language, and a session ID stored in sessionStorage (not cookies). Returns instantly. Visitors never notice.
The Worker (Cloudflare) — A serverless function at the edge. Receives the beacon, enriches it with geo data (country, city, region) from Cloudflare's network for free, parses the User-Agent for browser/OS/device, and writes to D1. Returns "ok" immediately — the database write happens in the background via ctx.waitUntil().
D1 Database — Cloudflare's SQLite-at-the-edge. A single page_views table stores everything. Free tier handles 100K writes/day — more than enough for most sites.
The Dashboard — A password-protected page on your site at /analytics/. Login hashes your password with SHA-256, sends it as a Bearer token. The Worker validates it. Chart.js renders the data. No analytics data exists in the HTML source — everything is fetched via authenticated API.
Every Dimension. No Third-Party API.
All of this comes free from the browser and Cloudflare's edge network:
Country & City
Cloudflare's request.cf gives you country, city, region, and timezone — no geo IP API needed.
Organization / ISP
Cloudflare's request.cf.asOrganization identifies the visitor's company or ISP from their ASN — for free.
Device Type
Mobile, Desktop, or Tablet — parsed from the User-Agent string on the server side.
Browser & OS
Chrome, Safari, Firefox, Edge — plus Windows, macOS, iOS, Android, Linux.
Screen & Viewport
Both monitor resolution (screen.width) and actual browser window size (innerWidth).
Referrer
Where they came from — search engines, social media, direct visits. document.referrer tells all.
Search Keywords
What they Googled before finding you — parsed from the referrer's q= query parameter.
Time on Page
How long they actually stayed. Sent via visibilitychange exit beacon when the tab hides.
Scroll Depth
How far they scrolled — tracked via requestAnimationFrame. Max percentage captured on exit.
New vs Returning
A persistent localStorage visitor ID distinguishes first-timers from returning readers.
Entry & Exit Pages
Where journeys start and where people leave. Session page counter identifies the first and last page.
UTM Campaigns
Track shared links: ?utm_source=linkedin&utm_medium=social shows exactly which campaigns drive traffic.
404 Detection
Broken links detected automatically — the tracker checks if the page title or H1 contains "404" or "not found".
Page Load Time
From the Performance Navigation Timing API — average and slowest load times across the site.
Language & Timezone
navigator.language and request.cf.timezone reveal when and how your global audience reads.
Dark Mode Preference
prefers-color-scheme tells you whether visitors prefer light or dark interfaces.
One Script. Sixteen Dimensions.
The tracker does far more than record a page view. It captures scroll depth, time on page, search keywords, page load time, 404 detection, and UTM campaigns — all without cookies. Here is a simplified view of what it sends:
The file is named ps.js, not tracker.js. The directory is /lib/, not /analytics/. Names matter when ad blockers are watching. More on this in Part 2.
Key design decisions:
1. Two beacons per page. The first fires on load (page view + all dimensions). The second fires on visibilitychange (time on page + scroll depth). This captures both "what" and "how long".
2. Use a Blob, not a string. sendBeacon(url, string) sends with Content-Type text/plain. The server's request.json() may silently fail. Wrapping in new Blob([data], { type: 'application/json' }) ensures correct parsing.
3. sessionStorage + localStorage. Session ID resets on tab close (session tracking). Visitor ID persists forever (new vs returning). Neither is a cookie. No consent banners needed.
4. 404 detection. The tracker checks if the page title contains "404" — broken links get flagged automatically in the dashboard.
Your Backend in 200 Lines
The Cloudflare Worker handles three endpoints:
POST /api/v— Records a page view (non-blocking)GET /api/stats— Returns dashboard data (authenticated, cached)GET /api/realtime— Active visitors in last 5 minutes
Geo + organization enrichment — free from Cloudflare
The asOrganization field identifies the company or ISP that owns the visitor's IP range. When someone visits from a corporate network, you see the organization name. When they visit from home, you see their ISP. No third-party reverse-IP service needed.
Non-blocking writes — return instantly
Batch queries — one round-trip, 26 queries
All 26 queries execute in a single D1 round-trip. The dashboard loads in under 200ms. Results are edge-cached for 60 seconds — repeat loads are instant.
Password-Protected. Data-Rich.
The dashboard lives at /analytics/ on your site. It's a single HTML page with a login screen.
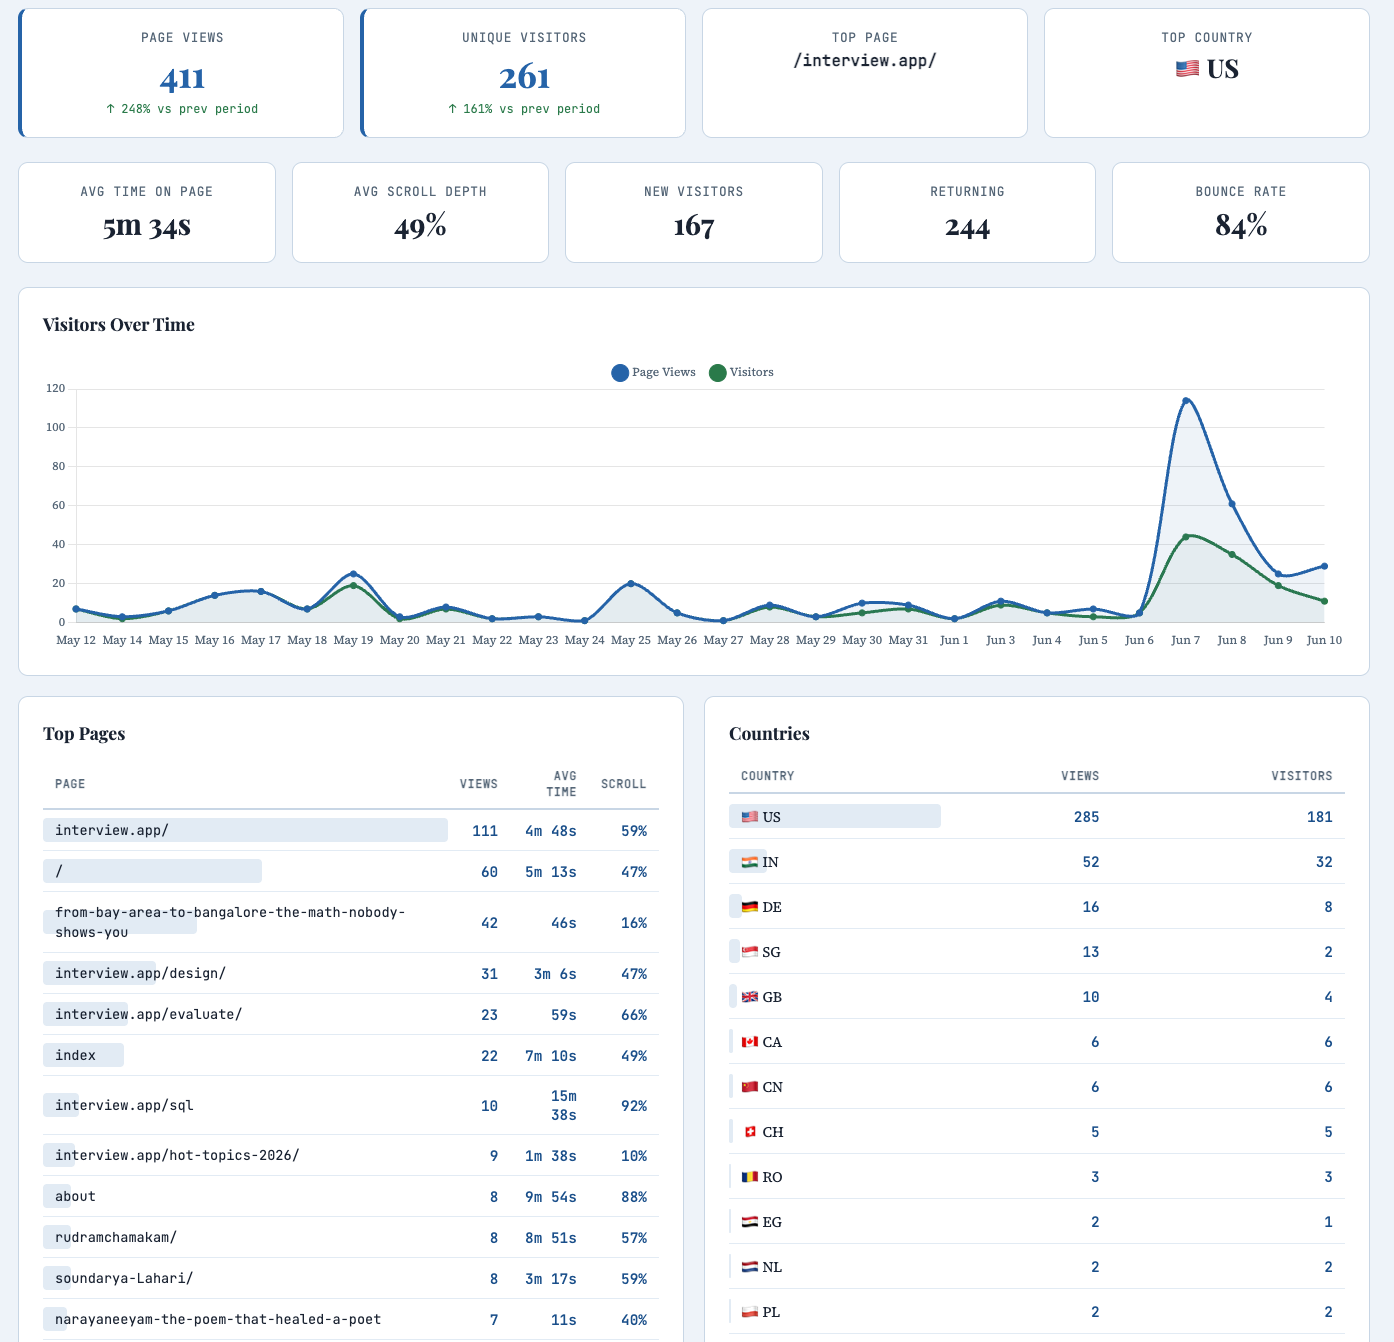
Here is the dashboard with real data — 411 page views, 261 unique visitors, 5m 34s avg time, 49% scroll depth, week-over-week trends, and top pages with per-page read time:
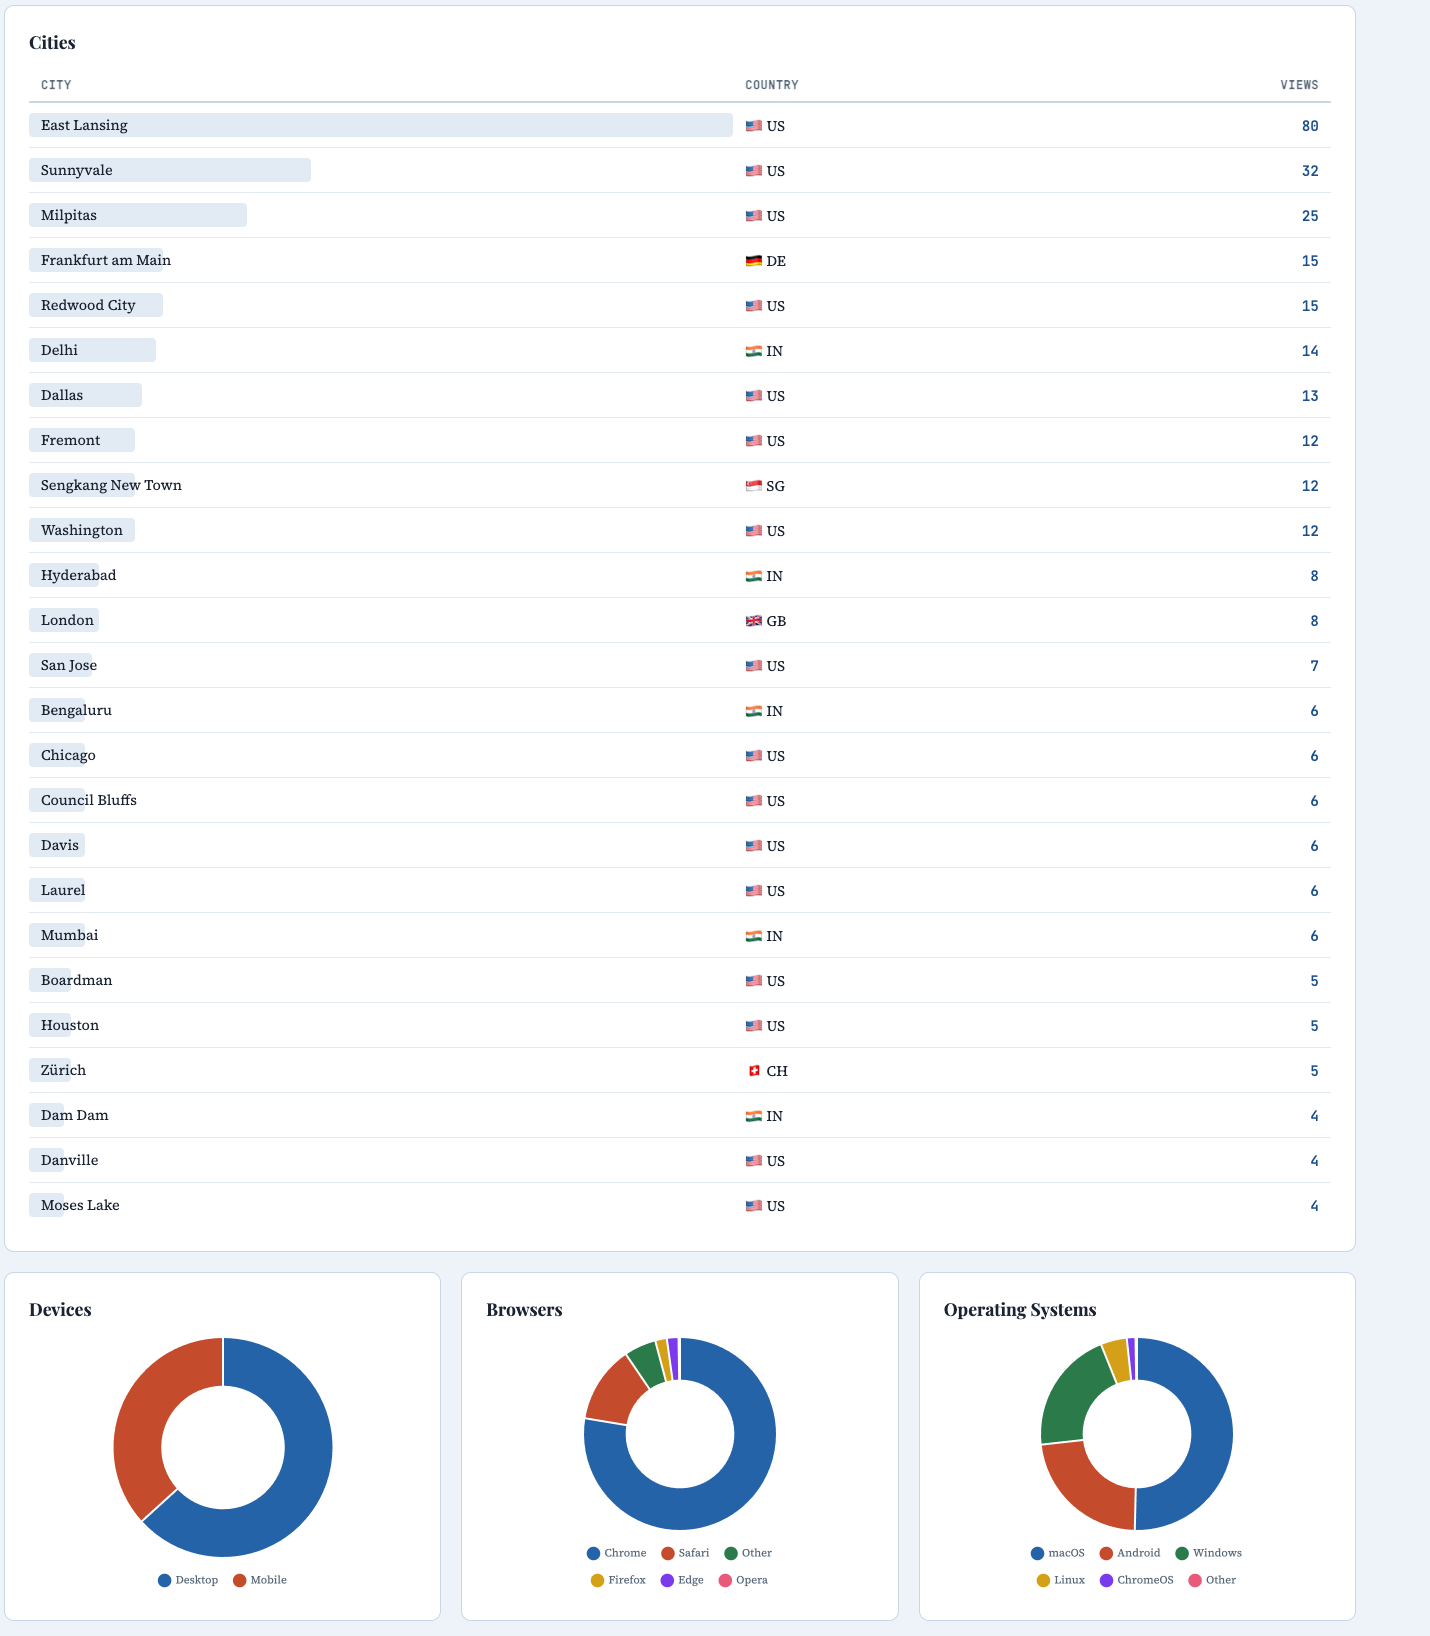
Cities from around the world, device/browser/OS breakdown:
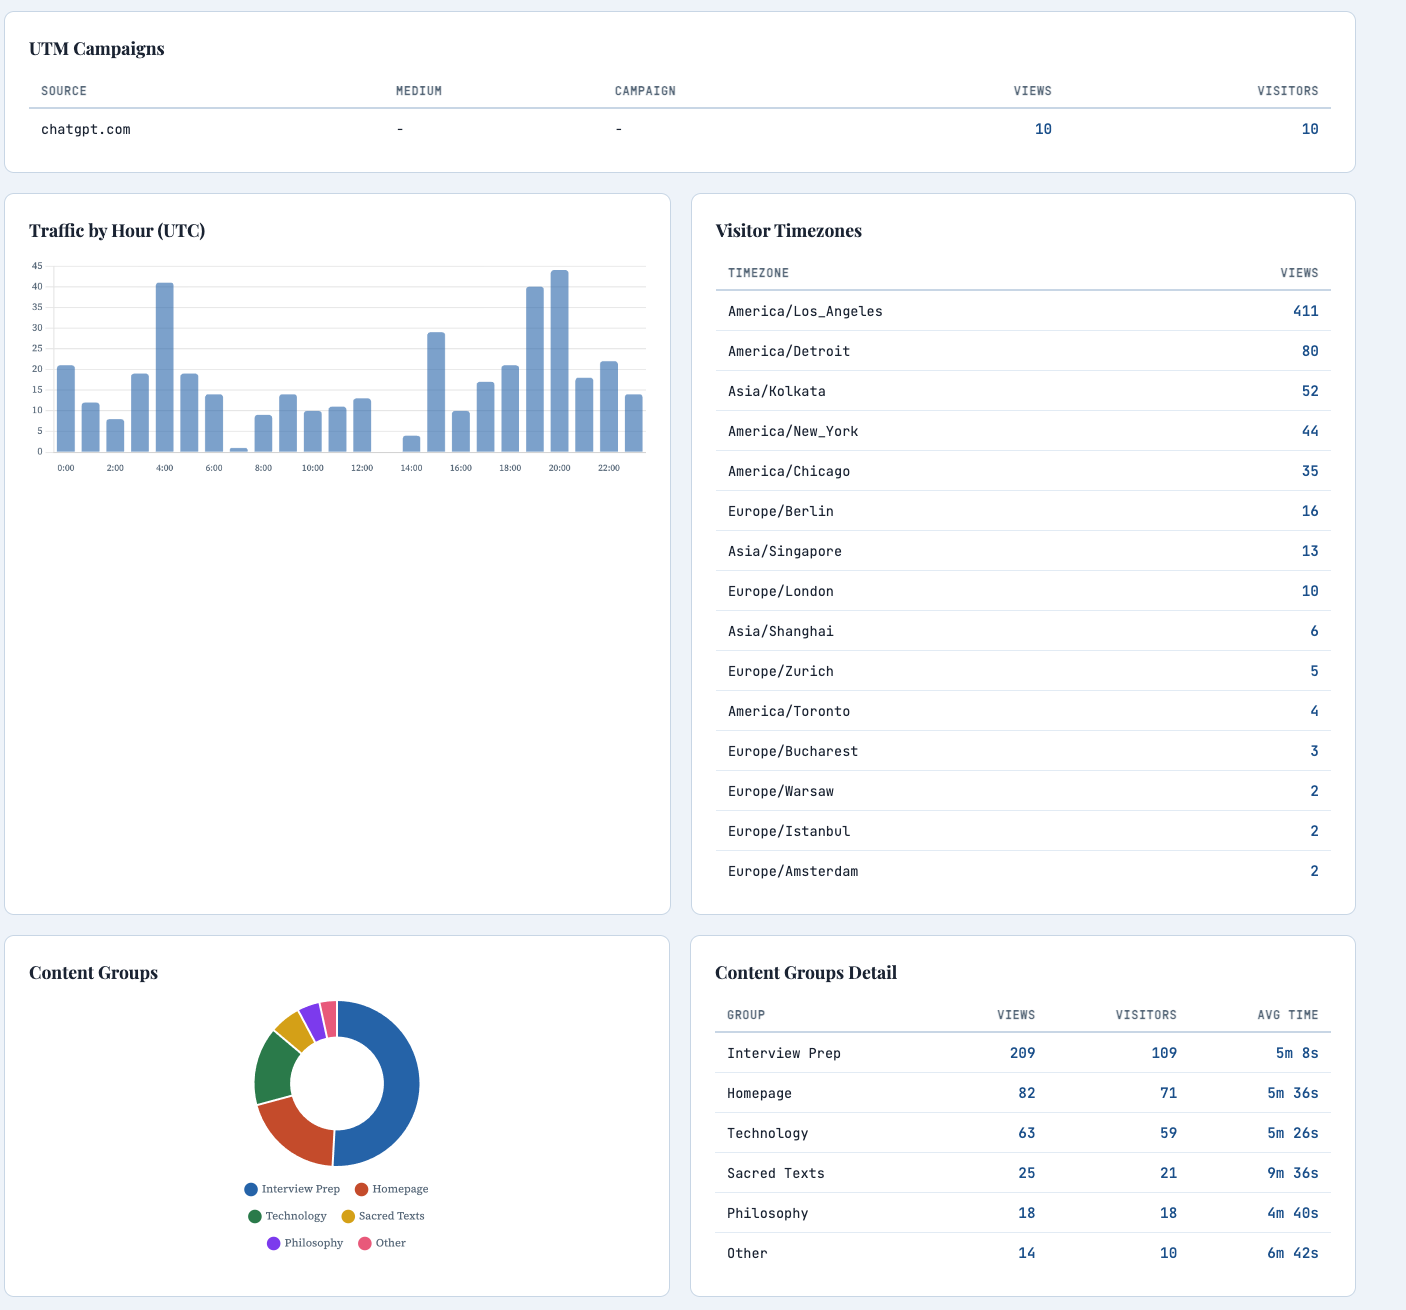
UTM campaigns, hourly traffic heatmap, visitor timezones across the globe, and content groups showing Interview Prep as the dominant category at 209 views:
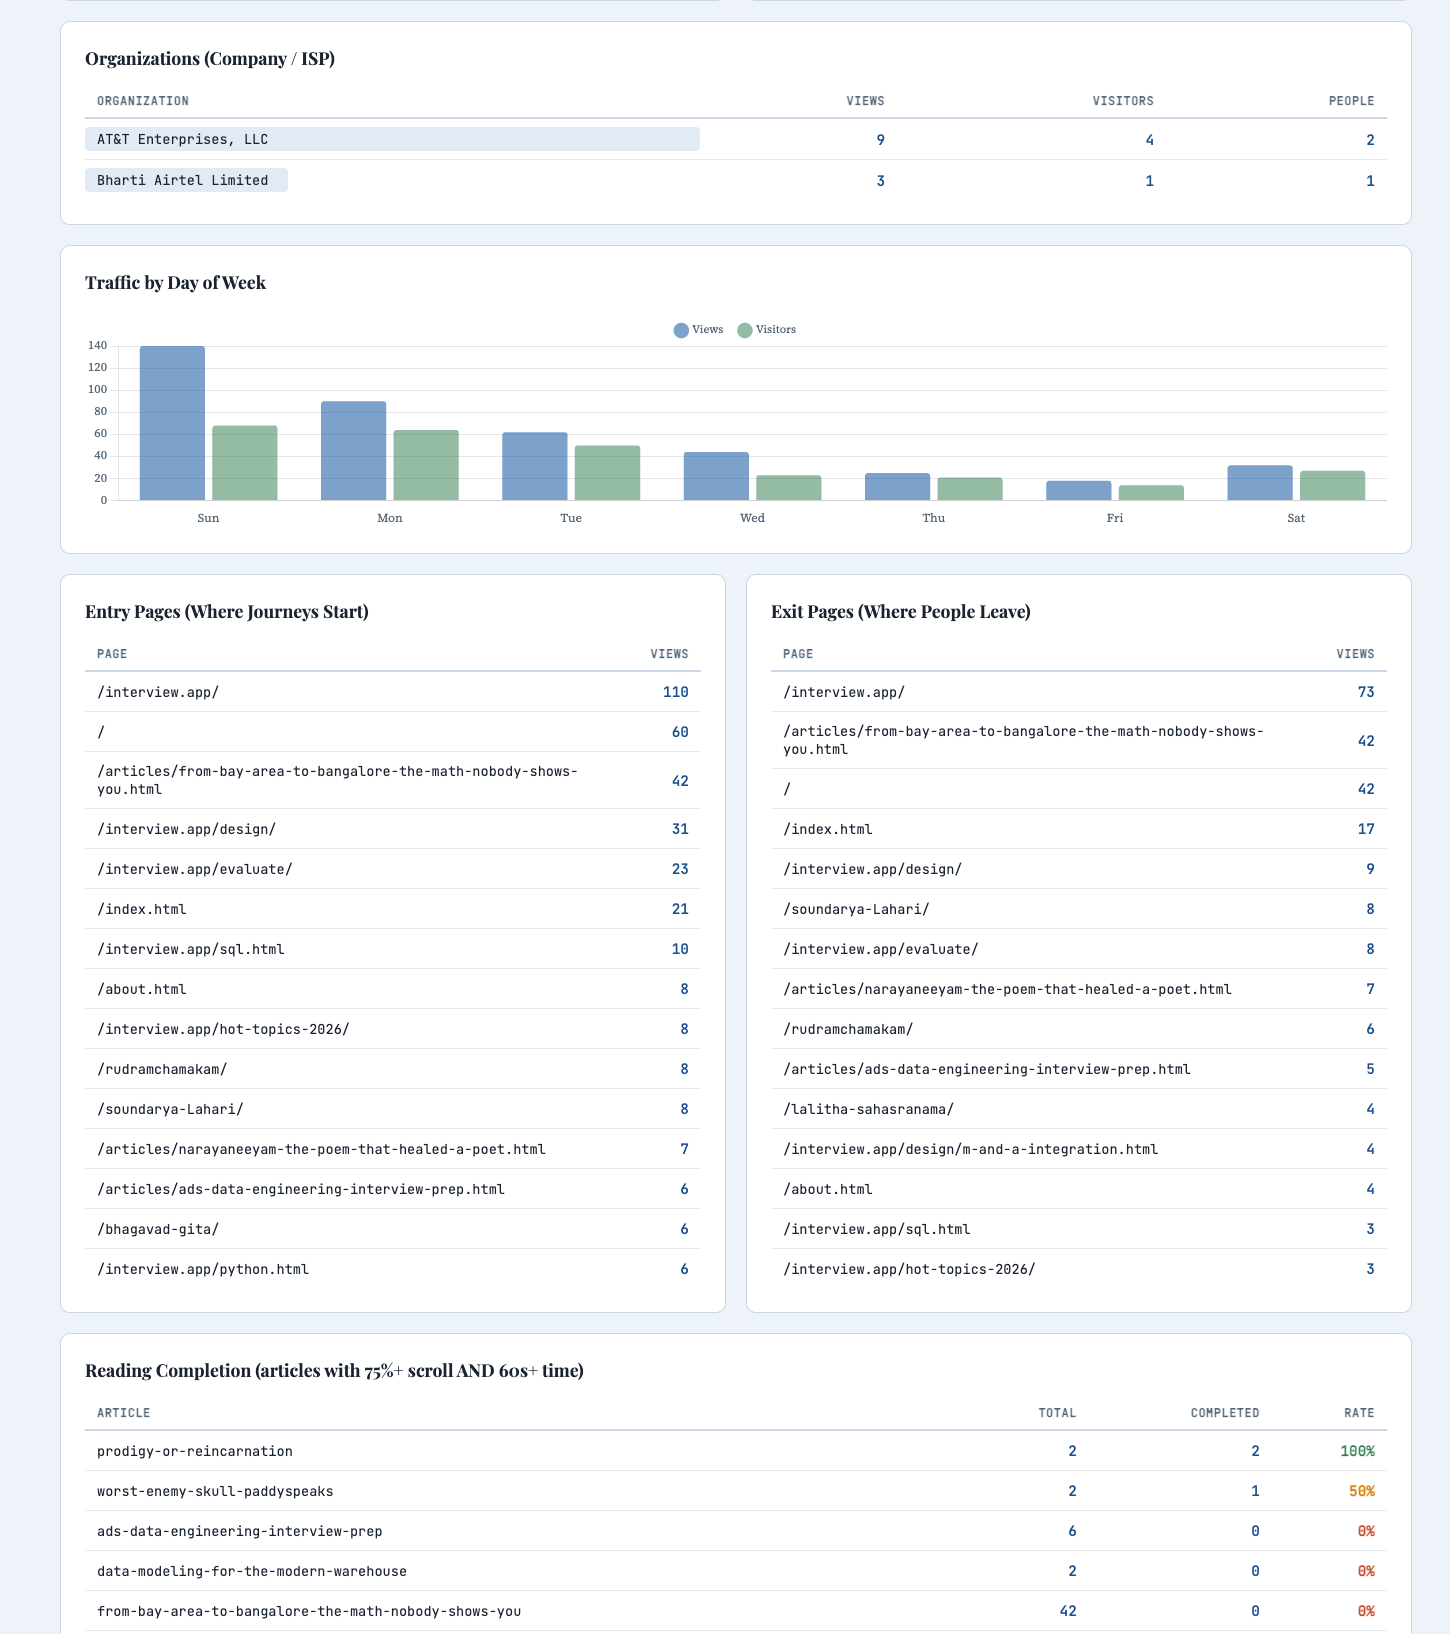
Organizations identified from ASN data, day-of-week traffic patterns, entry pages showing where journeys begin, exit pages showing where people leave, and reading completion rates:
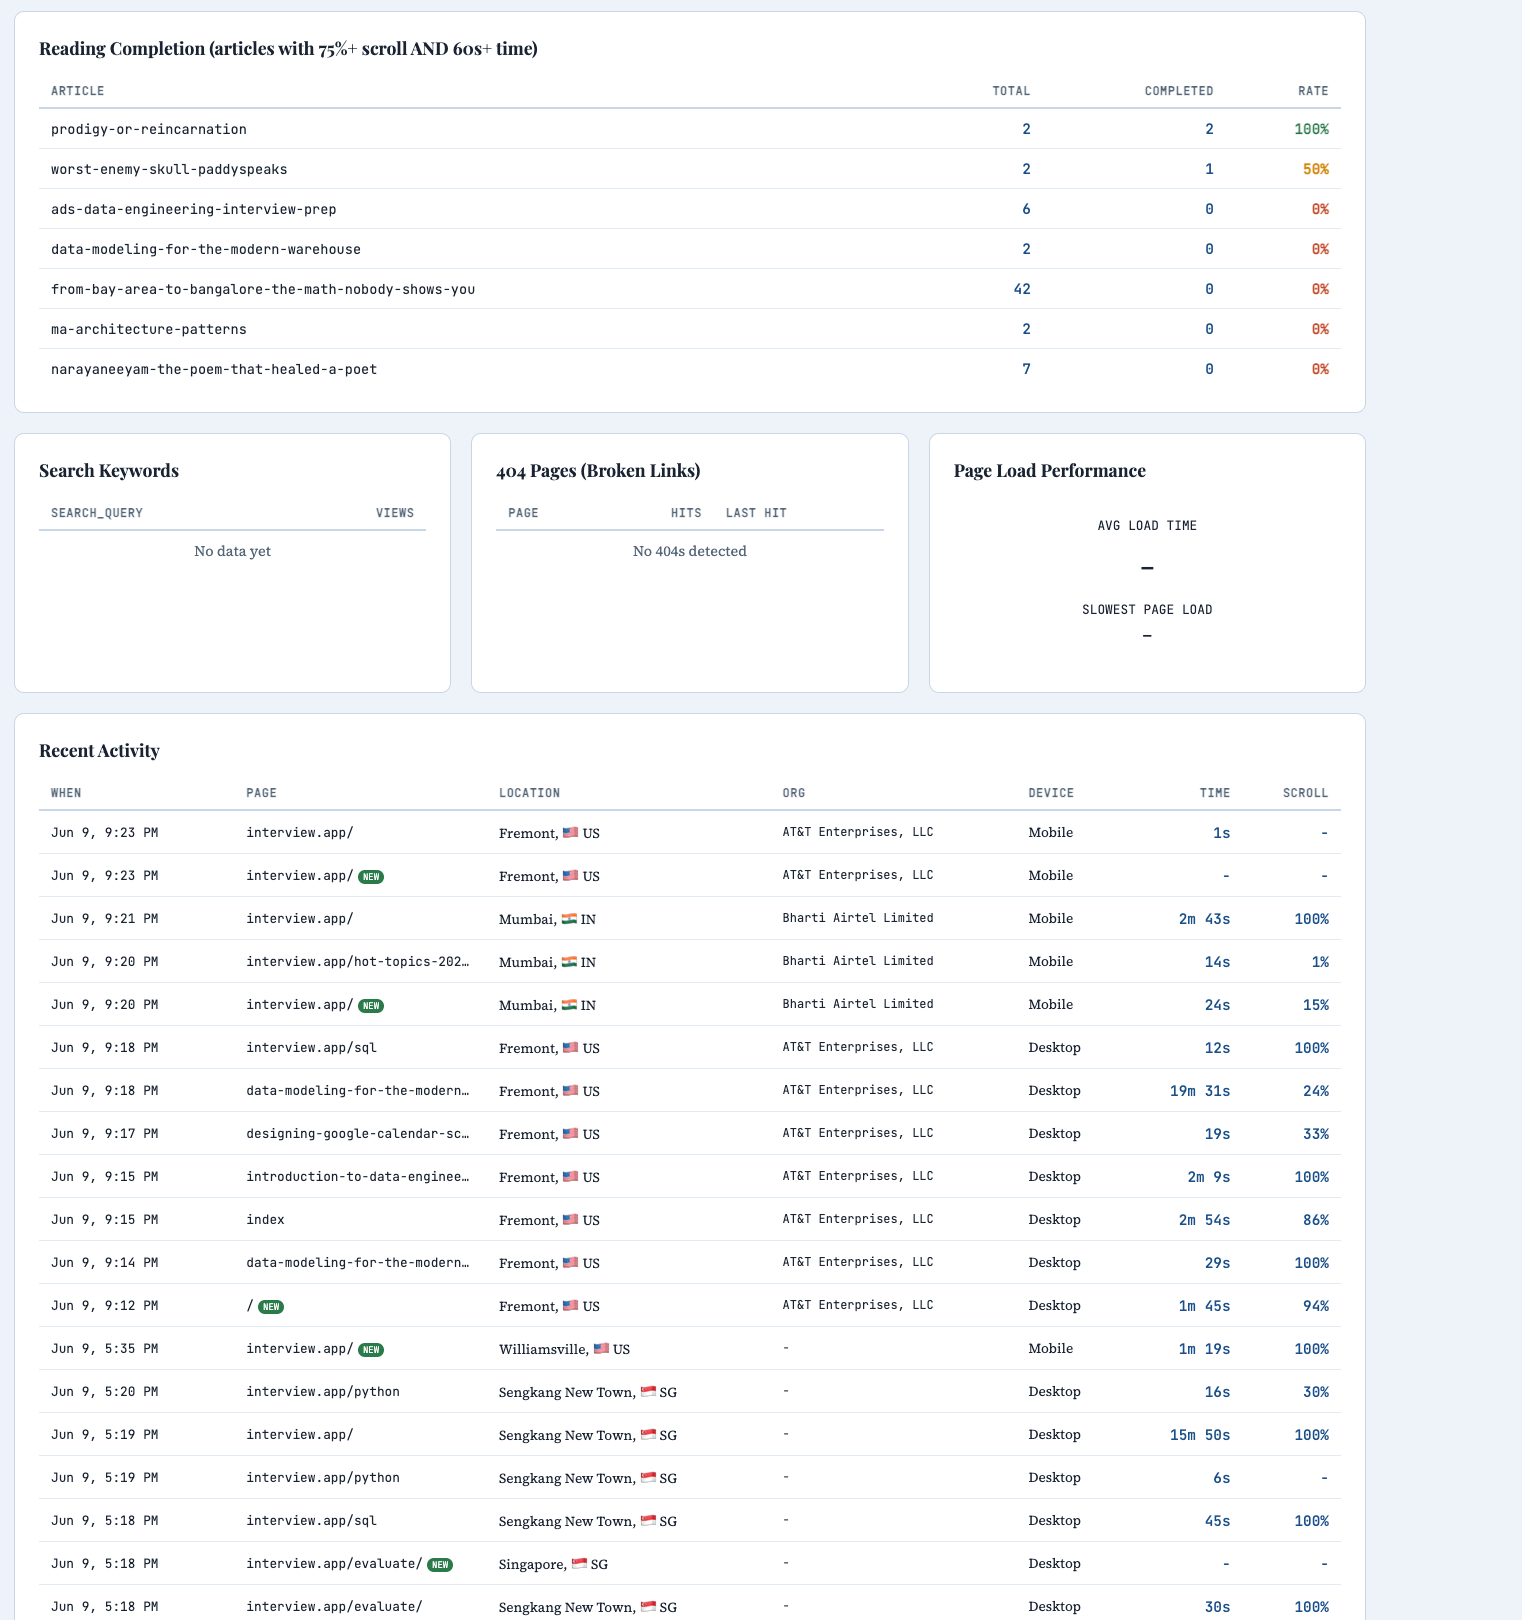
Search keywords, 404 broken link detection, page load performance, and the real-time activity feed showing every visit with timestamp, page, location, organization, device, time spent, and scroll depth:
When you log in, the page hashes your password with SHA-256 in the browser, sends it as a Bearer token, and the Worker compares it against the stored hash. If it matches, you get your data. If not, nothing.
What the dashboard shows
The dashboard has over 20 panels organized in a clear hierarchy:
- Summary cards: Page views, unique visitors, avg time on page, avg scroll depth, new visitors, returning visitors, bounce rate — each with week-over-week trend arrows.
- Visitors over time: Line chart with daily views and visitors.
- Top pages: With avg read time and scroll % per page. Click any row to drill down.
- Geography: Countries with flag emojis, cities — all clickable for drill-down.
- Content groups: Automatic categorization — Philosophy, Interview Prep, Sacred Texts, Technology — with a doughnut chart and avg time per group.
- Devices, Browsers, OS: Three doughnut charts side by side.
- Organizations: Which company or ISP visitors come from — identified by ASN via Cloudflare. Clickable to see which pages each organization reads.
- Referrers, Screen Resolutions, Languages, UTM Campaigns, Hourly Traffic, Timezones, Day of Week.
- Entry & Exit pages: Where journeys start, where people leave.
- Reading completion: Articles where readers scrolled 75%+ AND spent 60s+ = "actually read it".
- Search keywords: What people searched before finding you.
- 404 broken links: Pages returning "not found" with hit count and timestamp.
- Page load performance: Average and slowest load times.
- Recent Activity feed: Last 50 visits with timestamp, page, location, organization, device, time on page, scroll depth, and badges for new visitors and UTM sources.
Drill-down filtering
Click any row in the Countries, Pages, Cities, Organizations, or Referrers tables — the entire dashboard filters to show only that dimension. Click "US" to see which pages US visitors read. Click an article to see which countries read it. Combine filters: click US, then click a specific article, and see that article's US traffic. A filter bar at the top shows active filters with clear buttons.
Self-exclusion
Click "Exclude Me" in the dashboard header to remove your own visits from all stats. Works per device — click once from your work laptop, once from your phone, once from home. The dashboard then shows only real visitor traffic.
CSV export
Click "Export CSV" to download raw analytics data (up to 10,000 rows) for offline analysis in Excel, Google Sheets, or Python.
Dark mode
The dashboard automatically switches to dark mode based on your system preference via prefers-color-scheme.
The page is marked noindex, nofollow so search engines ignore it entirely.
Browser Only. No CLI Required.
Every step can be done from your browser — no terminal, no npm, no wrangler CLI.
Sign up for Cloudflare
Free tier. Go to dash.cloudflare.com and create an account.
Create a Worker via GitHub
Workers & Pages → Create → Continue with GitHub → select your repo → set root directory to
/analytics/worker.Create the D1 Database
D1 → Create → name it. Click into it → Console tab → paste the CREATE TABLE SQL → Execute.
Generate your password hash
Open any browser console and run:
crypto.subtle.digest('SHA-256', new TextEncoder().encode('your-password')).then(b => console.log(Array.from(new Uint8Array(b)).map(x => x.toString(16).padStart(2,'0')).join('')))Set the Secret
Worker → Settings → Variables and Secrets → Add → type: Secret, name:
ADMIN_PASSWORD_HASH, value: your hash.Add a Custom Domain
Worker → Settings → Domains → Add Custom Domain →
ps.yourdomain.com. This bypasses ad blockers.Add the tracker to all pages
Add
<script defer src="/lib/ps.js"></script>before</body>on every page. Deploy.
When Things Break
We built it. We deployed it. And nothing worked. No data, no errors, just silence. Here is how we debugged every failure — and a masterclass in Chrome DevTools.
The analytics system was live. The tracker was on every page. The Worker was deployed. The database was ready. And the dashboard showed... nothing. Not an error. Not a warning. Just empty charts staring back at us.
What followed was a debugging odyssey that touched every corner of Chrome DevTools — the Network tab, the Console, CORS errors, ad blockers, silent failures, and invisible browser guards. Every single issue taught a lesson that generalizes far beyond analytics.
This is that story, told as a practical guide you can use the next time your code silently refuses to cooperate.
Your Debugging Command Center
Chrome DevTools is built into every Chrome and Edge browser. It is the single most powerful debugging tool a web developer has. Here is how to open it and what each panel does.
Three ways to open DevTools
Keyboard Shortcut
F12 on Windows/Linux
Cmd + Option + I on Mac
This is the fastest way. Memorize it.
Right-Click → Inspect
Right-click any element on the page and select "Inspect". Opens DevTools with that element selected in the Elements panel.
Menu
Chrome menu (⋮) → More Tools → Developer Tools. Useful if keyboard shortcuts are disabled.
The six panels you need to know
Elements — See and edit the live HTML/CSS of the page. Right-click any element → Inspect to jump here. Change styles in real-time. Debug layout issues.
Console — Run JavaScript commands. See errors and warnings. Test API calls. Inspect variables. This is your interactive terminal.
Sources — Browse all loaded files. Set breakpoints. Step through code line by line. Find where functions are defined.
Network — See every HTTP request. Check status codes, headers, payloads, and timing. Filter by type (XHR, JS, CSS, images).
Application — Inspect cookies, localStorage, sessionStorage, IndexedDB, service workers, and cache storage.
Performance — Record page load or interaction, see flame charts, identify bottlenecks, measure FPS and memory usage.
Run Commands. Inspect Everything.
The Console is where you talk to the browser. Open it with F12 → Console tab (or press Esc while in any other panel to open a console drawer at the bottom). Here are the commands you'll use most:
Inspecting the page
Testing API calls directly
When the tracker isn't working, bypass it entirely and test the server:
Generating a SHA-256 hash (for dashboard password)
Useful console methods
Pro tip: Press the up arrow in the Console to cycle through previous commands. Press Ctrl+L to clear. Type any variable name and press Enter to inspect it. The Console remembers everything until you close the tab.
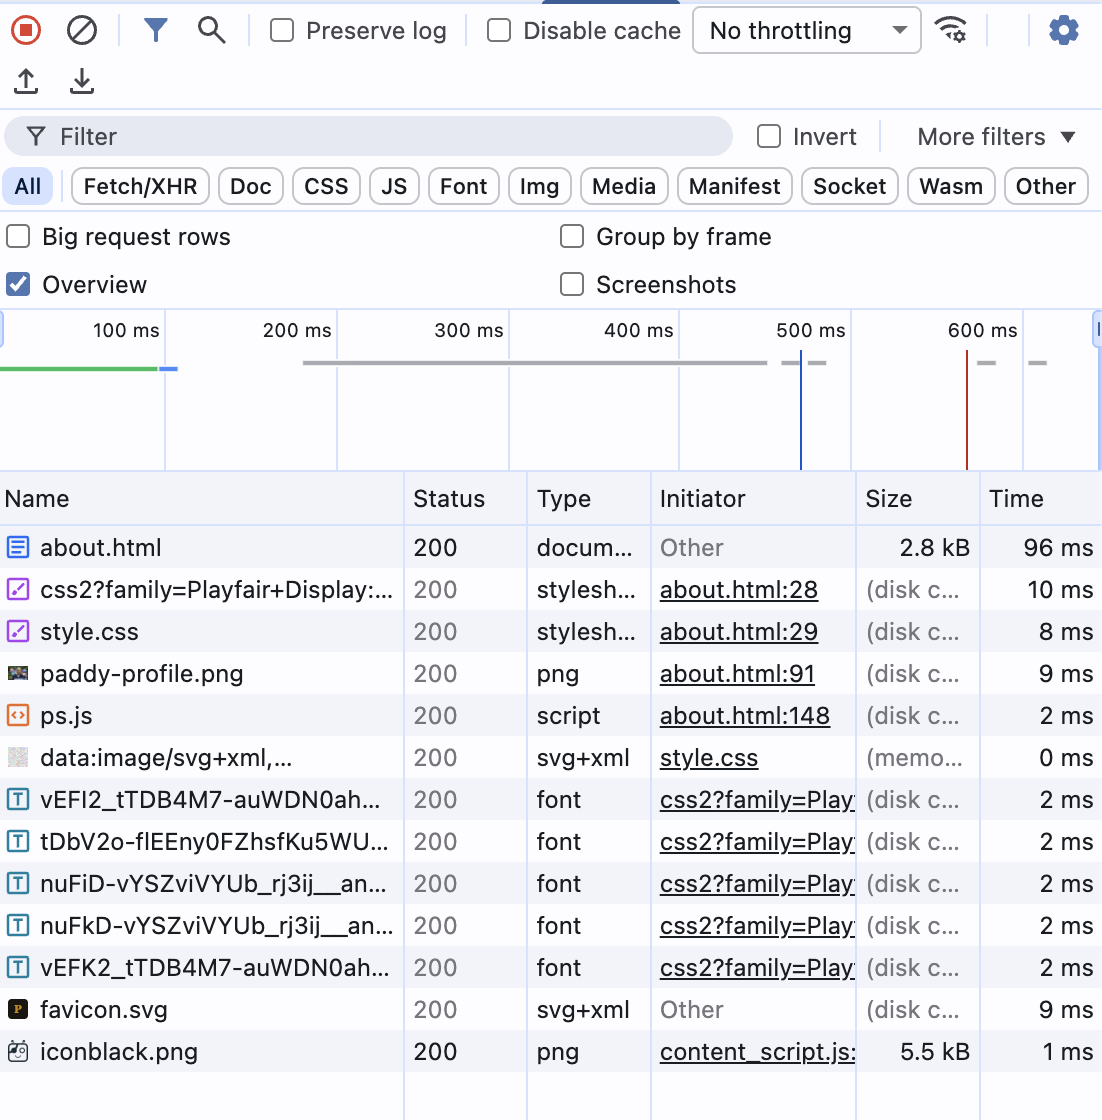
See Every Request Your Browser Makes
Open DevTools → Network tab → refresh the page. Every file, image, font, API call, and beacon appears here in chronological order.
Understanding each column
- Name — The file or endpoint requested. Click it to see full details (headers, payload, response).
- Status — 200 = success. 304 = cached. 404 = not found. 500 = server error. (blocked) = ad blocker killed it. CORS error = cross-origin failure.
- Type —
document= HTML page.stylesheet= CSS.script= JS.ping= sendBeacon.fetch= fetch() API.preflight= CORS OPTIONS check. - Initiator — Which file and line number triggered this request.
ps.js:39means line 39 of ps.js. - Time — Total round-trip time. High values indicate slow servers or large files.
Clicking a request — the detail panels
Click any request in the Network tab to open its detail view with these sub-tabs:
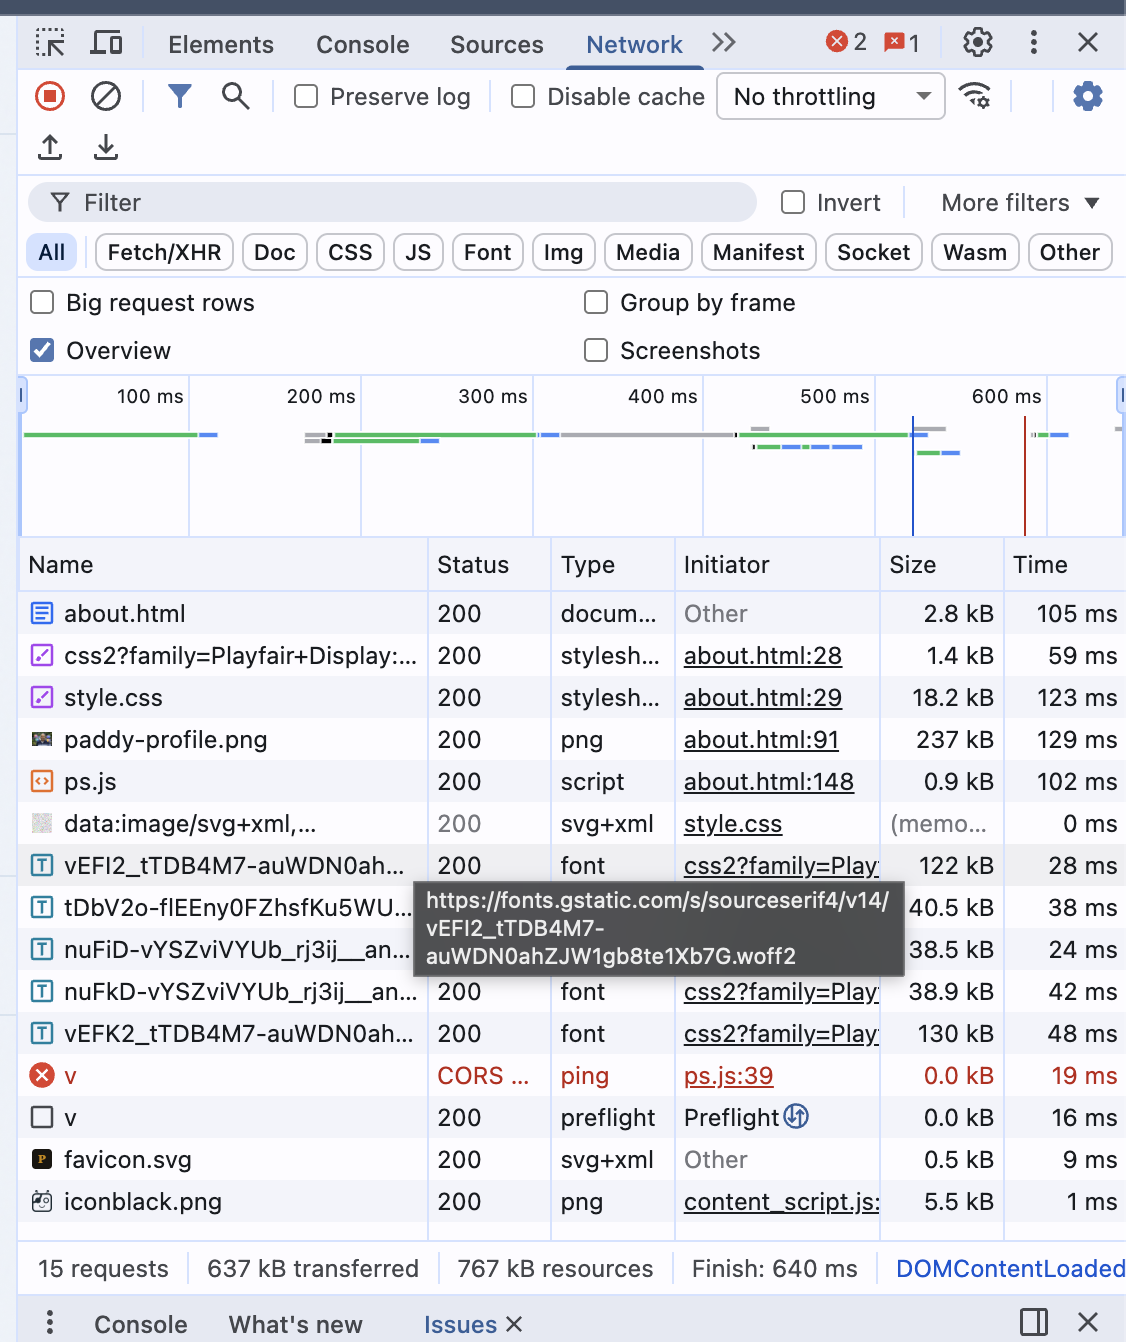
Headers
See request and response headers. Check Content-Type, Access-Control-Allow-Origin (CORS), Authorization, and status codes.
Payload
See what data was SENT with the request. For our tracker, this shows the JSON body: {p: "/about", r: "", s: "1920x1080"}.
Preview / Response
See what data came BACK from the server. For our stats API, this shows the full JSON with views, countries, etc.
Timing
Breakdown of DNS lookup, TCP connection, TLS handshake, waiting (TTFB), and content download. Identifies where slowness lives.
Network tab power features
Real example: ps.js loaded but no outbound request
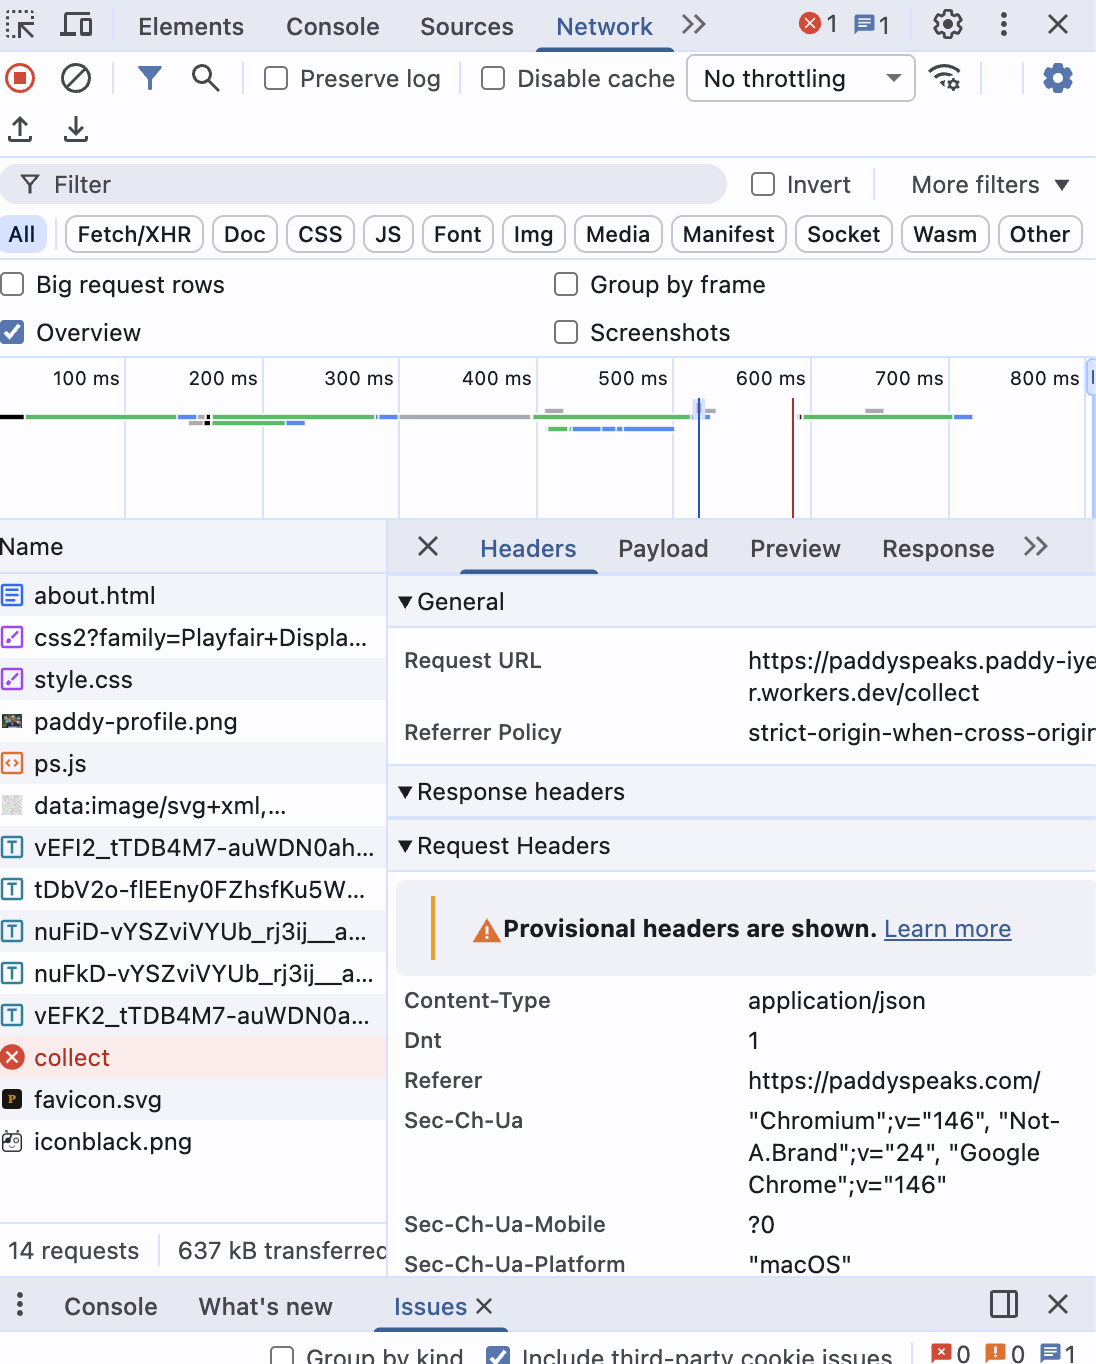
In this screenshot, notice that ps.js loaded successfully (200) but there is no collect or v request. The tracker script ran but exited silently — this was caused by navigator.doNotTrack being enabled:
Real example: dashboard API calls working
When the dashboard is working correctly, you see the realtime API calls returning 200 with preflight checks passing:
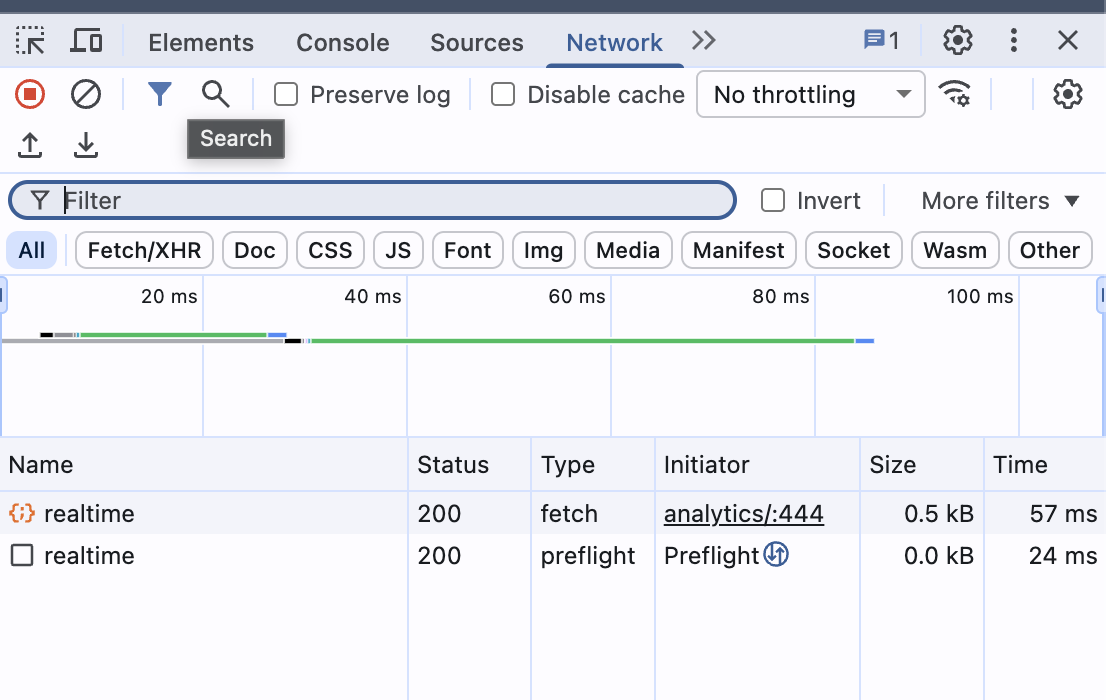
If your request doesn't appear in the Network tab, it never left the browser. The code either didn't run, hit a guard clause and returned early, or was blocked before execution. This is the most important signal: presence means "it tried", absence means "it didn't."
Inspect the Page. Inspect the Storage.
Elements panel: live HTML & CSS
Right-click any element on the page → Inspect. You jump straight to that element in the DOM tree. You can:
- Edit HTML — Double-click any tag or text to edit it live. Changes are temporary (refresh to reset).
- Edit CSS — In the Styles pane on the right, click any value to change it. Add new rules. Toggle properties with checkboxes.
- Check computed styles — Click "Computed" tab to see the final resolved values (after all CSS cascade).
- Find hidden elements — Elements with
display:noneorvisibility:hiddenare visible in the DOM tree even though you can't see them on the page. - Search the DOM — Press Ctrl+F in the Elements panel to search by text, CSS selector, or XPath.
Application panel: storage inspection
DevTools → Application tab (might be behind >> overflow menu). This is where you inspect browser storage:
Cookies
See all cookies for the current domain. Check name, value, domain, expiry, and flags (HttpOnly, Secure, SameSite). We use zero cookies.
Session Storage
Key-value pairs that live until the tab closes. Our tracker stores _ps_sid here — the anonymous session ID.
Local Storage
Key-value pairs that persist forever (until cleared). Useful for settings, tokens, or cached data. Our dashboard stores the auth token here.
To verify the tracker session ID exists, go to Application → Session Storage → your domain and look for _ps_sid.
The Elements panel in action
Here is what the Elements panel looks like when inspecting our analytics article. Notice the DOM tree on top showing every section, and the Styles pane below showing computed CSS for the <body> element:
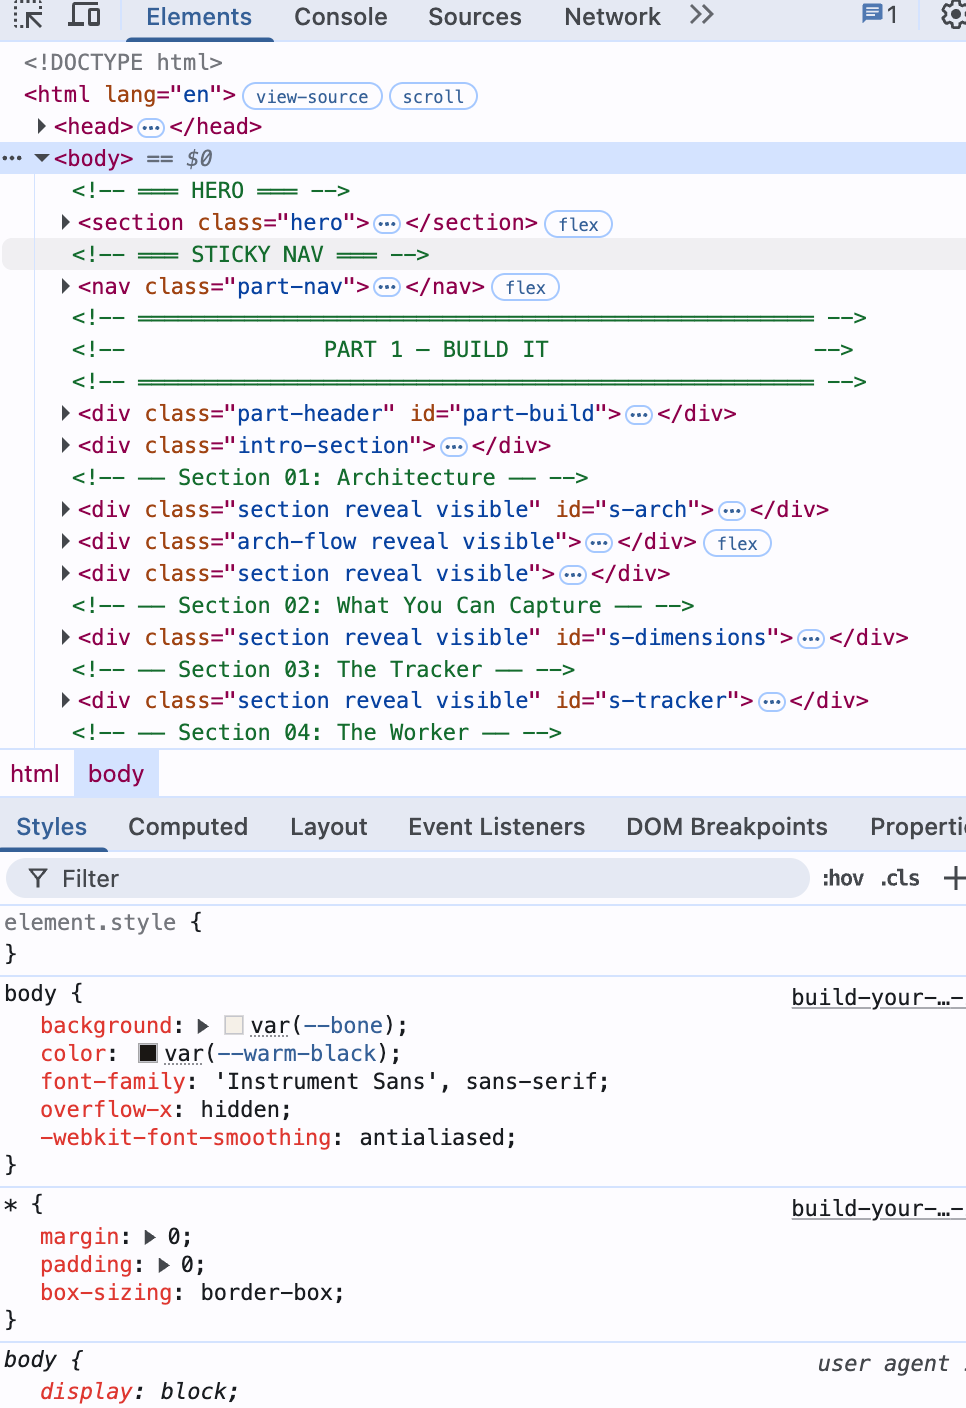
The Elements panel is your X-ray vision into any webpage. Right-click any element on the page → Inspect to jump straight to it in the DOM tree. Change text, toggle CSS properties, and see results instantly.
The Ad Blocker Wall
What it means
A browser extension (usually an ad blocker like uBlock Origin or AdBlock Plus) killed the request before it reached the server. The browser's network stack was told: "don't even try."
Here is what it looks like in the Console — a red error that tells you the resource was killed before reaching the server:
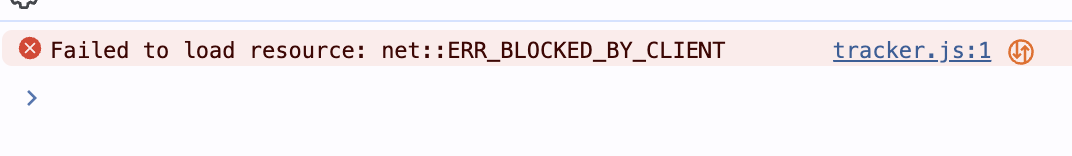
And in the Network tab, the request shows as (blocked) with type ping — the ad blocker intercepted the sendBeacon call. Click the request to see the Headers panel showing "Provisional headers" — meaning the request never actually left:
After renaming the endpoint from /collect to /api/v, the ad blocker STILL blocked it — this time matching on the workers.dev domain:
Ad blockers use pattern matching on URLs, domains, and request types. Here is our debugging timeline — four attempts before success:
Attempt 1: Rename the file
Changed analytics/tracker.js to lib/ps.js. Script loaded! But the beacon to /collect was still blocked.
Attempt 2: Rename the endpoint
Changed /collect to /api/v. Still blocked. The ad blocker wasn't matching the path — it was matching the domain.
Attempt 3: The domain itself
workers.dev is on every major ad blocker's domain blocklist. Any request to *.workers.dev gets killed regardless of the path.
Attempt 4: Custom domain
Added ps.yourdomain.com as a custom domain in Cloudflare. Same root domain as the website. Ad blockers don't touch it.
Ad blockers don't just block scripts. They block domains, URL patterns, and request types. The workers.dev domain is on every major blocklist. A custom subdomain of your own domain is the permanent fix.
When Domains Don't Trust Each Other
What it means
Your browser is a bouncer. When paddyspeaks.com tries to send data to ps.paddyspeaks.com, the browser asks the server: "Do you allow requests from this origin?" If the server doesn't respond correctly, the request is blocked.
The CORS handshake
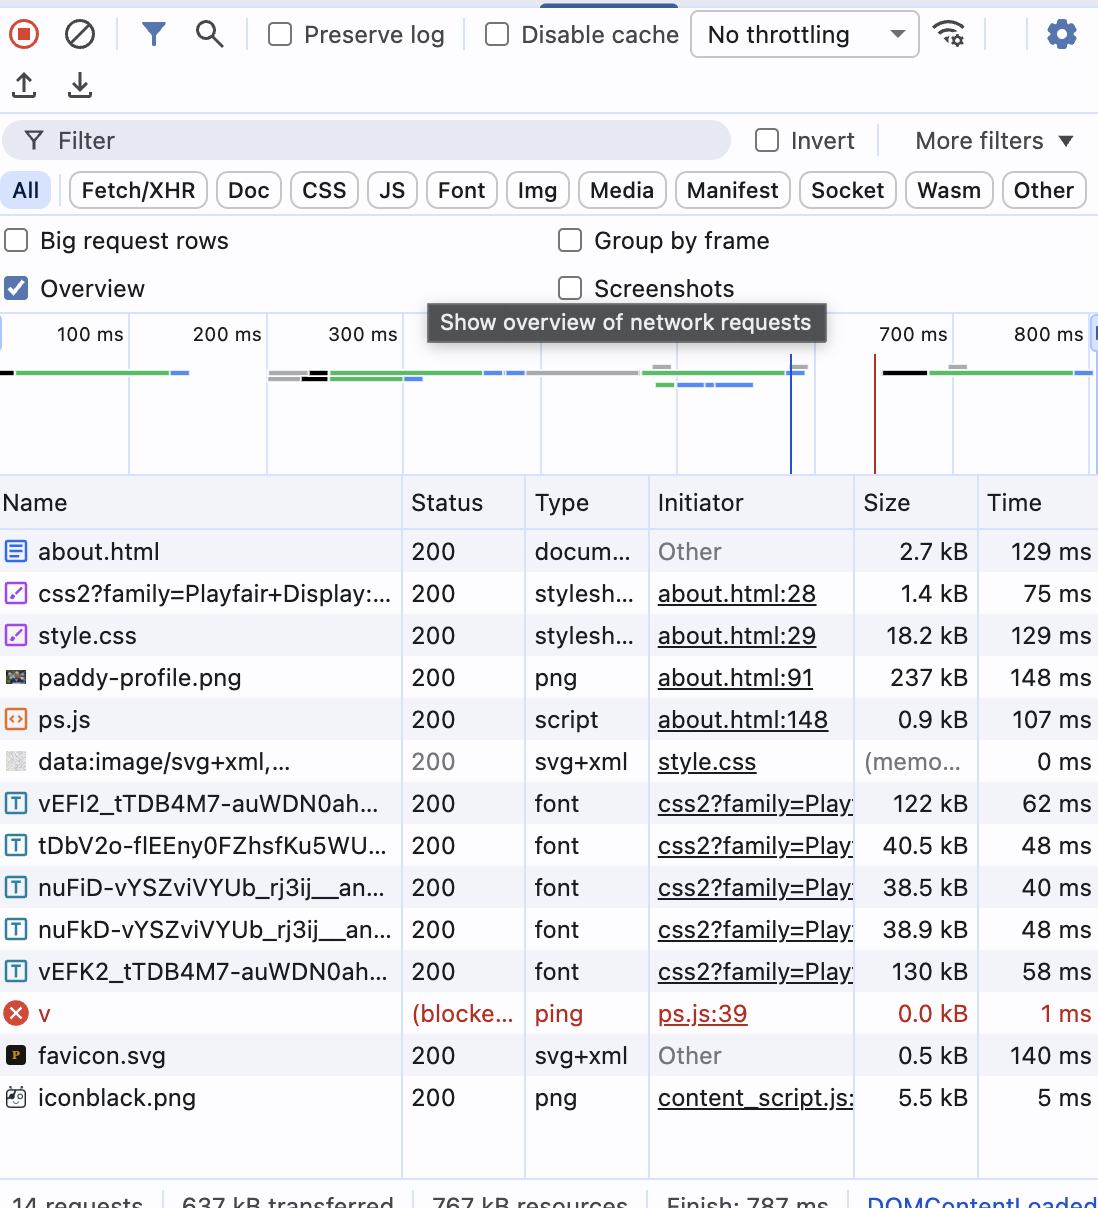
Here is what a CORS error looks like in the Network tab. Notice the preflight (OPTIONS) returned 200, but the actual ping request shows CORS error. The Issues panel at the bottom flags it: "Ensure credentialed requests are not sent to CORS resources with origin wildcards":
And here is the full browser view — the page loaded fine, but the analytics beacon failed silently with a CORS error visible only in DevTools:
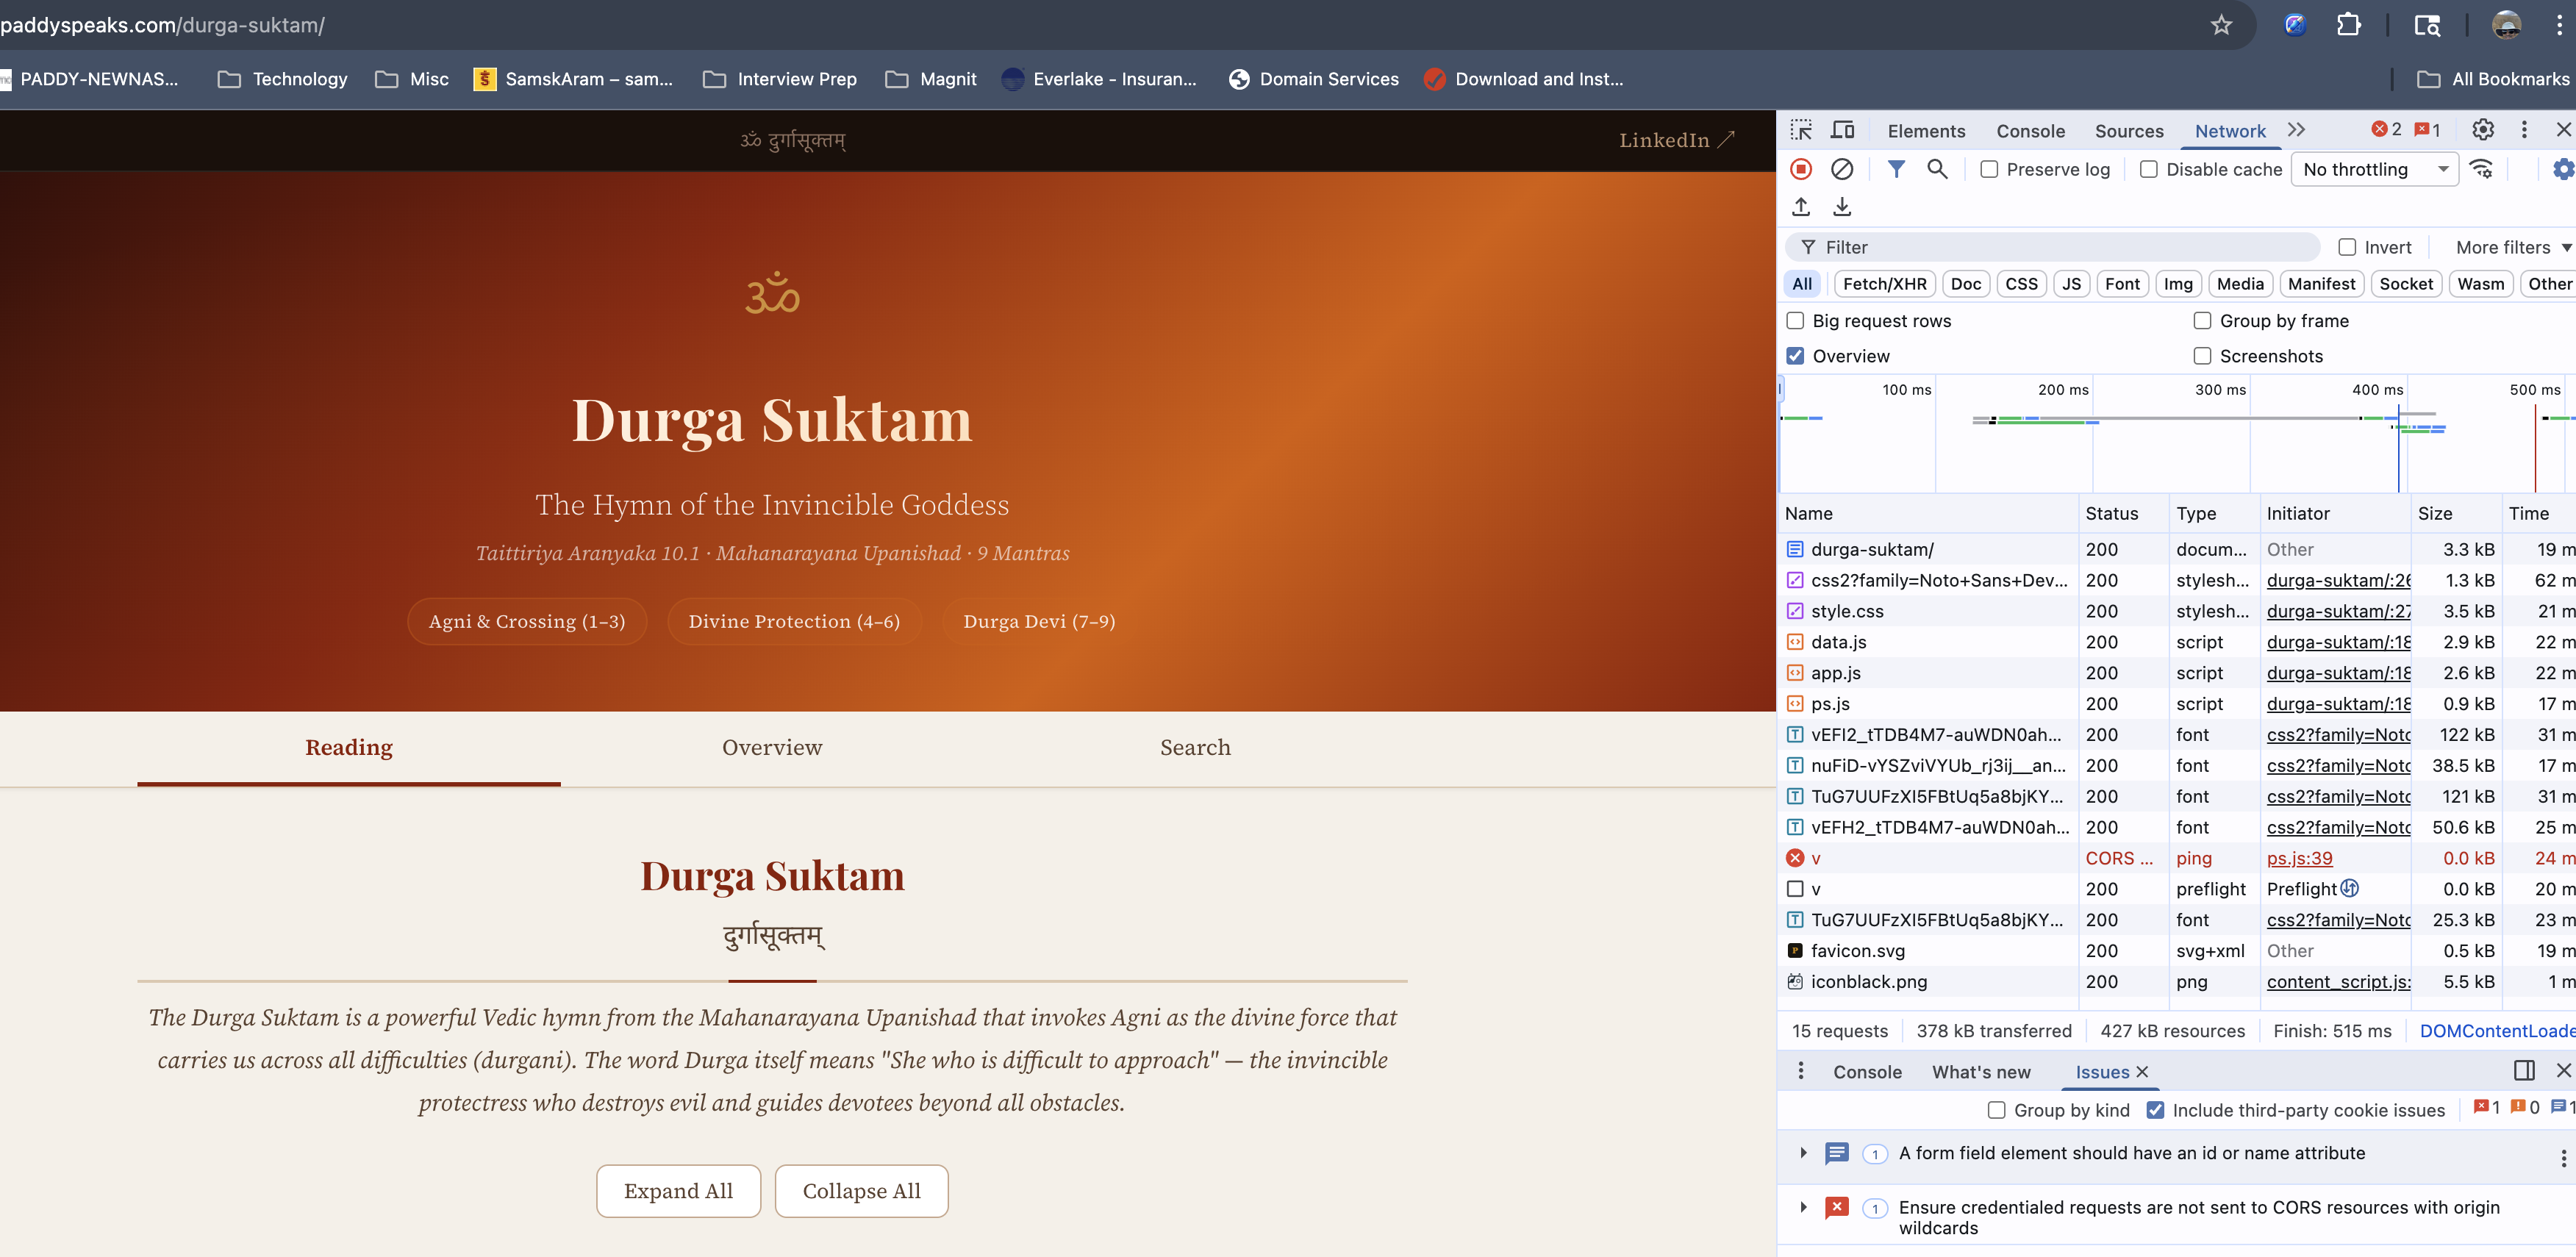
Our specific issue: ps.paddyspeaks.com is a subdomain, so cookies for .paddyspeaks.com are sent automatically. This makes it a credentialed request — and credentialed requests cannot use the wildcard * origin.
Problem
Access-Control-Allow-Origin: * with cookies = browser rejects the response. Wildcard is not allowed for credentialed requests.
Solution
Return the specific Origin header from the request, plus Access-Control-Allow-Credentials: true.
Reading the Red Text
The Console tab (F12 → Console) shows JavaScript errors. Here is what multiple errors look like stacked together — each one telling a different story:
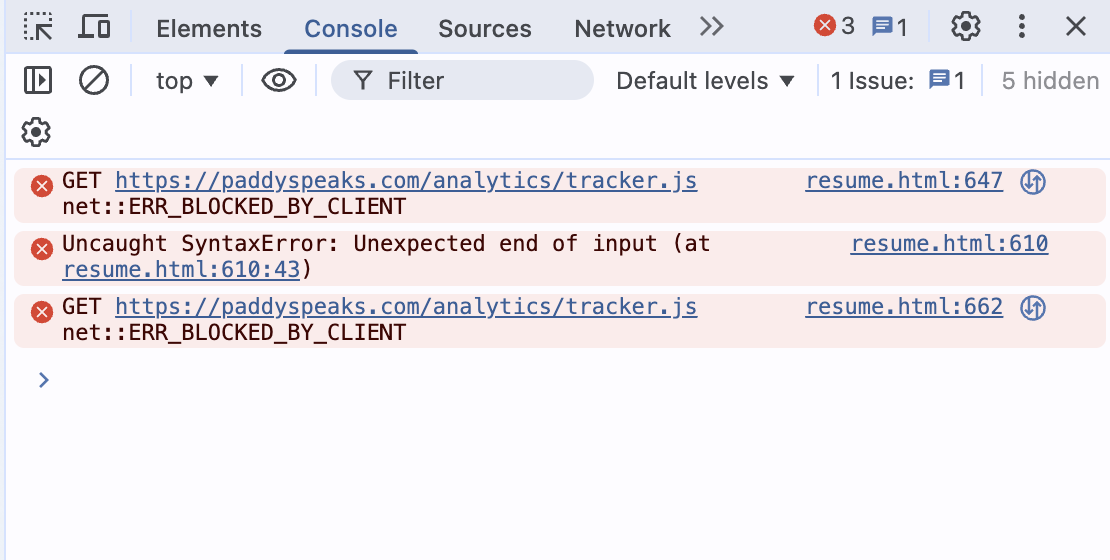
Read each error from top to bottom. The file and line number on the right (e.g., resume.html:610) is a clickable link — it takes you directly to the problem in the Sources panel. Here are the three errors we hit and what each one teaches:
JavaScript hoisting strikes again
The function loadDashboard was called on line 432, but defined on line 473. In JavaScript, function foo() {} declarations are hoisted (available everywhere), but window.foo = function() {} assignments are NOT. They execute top-to-bottom.
function loadDashboard() {} (declaration) instead of window.loadDashboard = async function() {} (assignment).A script tag inside a template literal
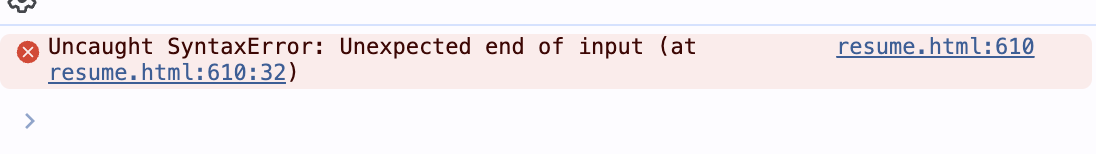
When we injected the tracker using sed before every </body>, it also matched </body> tags inside JavaScript template strings (backtick strings for print/export). The injected <script> tag broke the template literal's syntax.
Same as Network tab — ad blocker
This error appears in Console when a resource is blocked by a browser extension. The Network tab shows the same info with more detail (status, type, initiator).
No Error. No Warning. No Data.
The hardest bugs aren't the ones that scream. They're the ones that whisper.
Do Not Track: The invisible guard
The tracker loaded (200 in Network tab). No console errors. But no /api/v request was sent. The data was simply... missing.
The culprit: navigator.doNotTrack === '1'. Our tracker had a guard clause that silently returned if Do Not Track was enabled. Many browsers enable DNT by default. The W3C abandoned the DNT specification years ago. Even privacy-respecting tools like Plausible and Umami ignore it.
Symptom
Script loads (200), no errors, but no outbound request in Network tab. Complete silence.
Diagnosis
Run navigator.doNotTrack in Console. If it returns "1", that's your blocker. Check the script's guard clauses.
sendBeacon Content-Type: The invisible mismatch
Even after fixing DNT, the D1 database was empty. The beacon was being sent (visible in Network tab). The Worker returned "ok". But no rows appeared in the database.
The root cause: sendBeacon(url, string) sends with Content-Type text/plain. The Worker's request.json() silently failed to parse it. Since the DB write was in ctx.waitUntil(), the error was swallowed — and the response was still "ok".
When there are no errors but nothing works, the bug is in the assumptions. Check guard clauses. Check Content-Types. Check what the server actually received versus what you think you sent.
A Systematic Approach
The next time something doesn't work, follow these steps in order:
Open the Network tab
Is the request being made? If it's not there, the code didn't fire. Check guards, ad blockers, and script loading.
Check the status code
200 = success. (blocked) = ad blocker. CORS error = missing headers. 500 = server crash. 401 = auth failure.
Open the Console tab
Red text = errors. Read the message and the file:line reference. Click to jump to the source.
Test the API directly
Run
fetch()in the Console with the correct headers. This bypasses the tracker and tests the server directly.Read the guard clauses
Open the source code (Sources tab). Look for early
returnstatements — DNT checks, prerender guards, bot filters.Check the server
Look at server logs, database console, or Worker metrics. The client may say "ok" but the server may be failing silently.
Quick Reference
| Symptom | Likely Cause | Fix |
|---|---|---|
(blocked) in Network | Ad blocker | Rename files, endpoints, or use custom domain |
CORS error | Missing or wrong headers | Return specific Origin + Credentials header |
Function not defined | JS hoisting — called before assignment | Reorder code or use function declarations |
SyntaxError: end of input | Broken template literal or missing bracket | Check for injected code inside JS strings |
| Script 200, no request sent | Guard clause (DNT, prerender) | Check navigator.doNotTrack, remove guard |
| Request 200, DB empty | Content-Type mismatch | Use Blob with application/json type |
| Incorrect password on dashboard | Secret overwritten by deploy | Re-set secret after each deployment |
You now own your analytics — every byte of visitor data sits in your database, viewed through your dashboard, protected by your password. No Google. No cookies. No consent banners.
And the next time something breaks — because it will — you know exactly where to look.
Read more at paddyspeaks.com