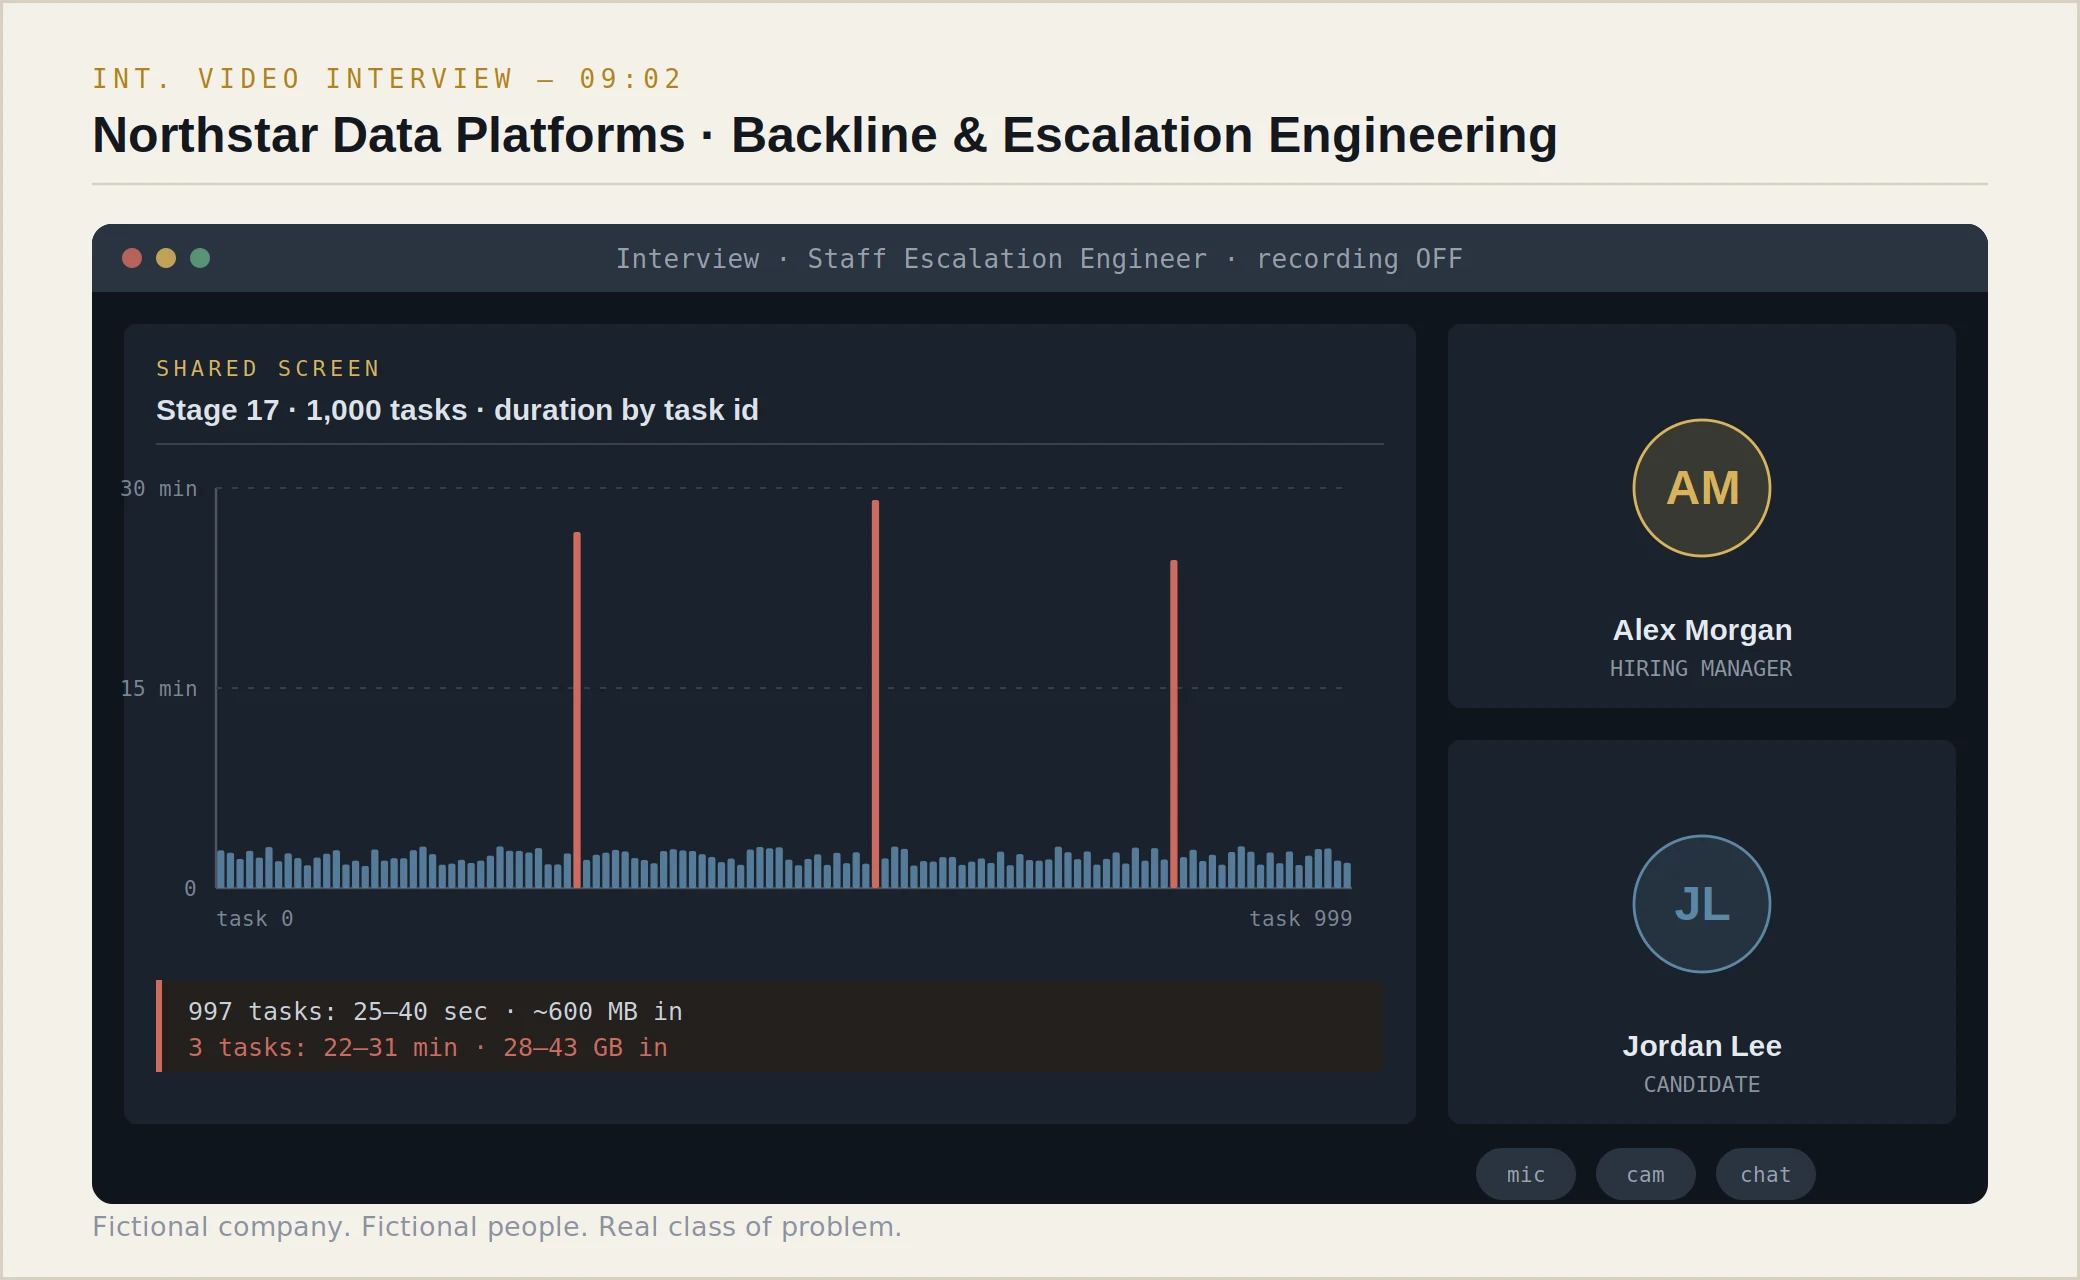
A fictional screenplay in fifteen acts
Spark, JVMs, distributed systems, debugging, customer escalations — and the questions behind the questions.
This interview is fictional. The people, the company, the incidents, the metrics and the systems have been created for educational purposes. Nothing here describes, quotes or represents the hiring process of any real company, and no character is based on any real person.
The technical situations, however, are representative composites of problems engineers do meet in large-scale environments — which is the whole point. Read it as a rehearsal script. Better still, read it aloud with a friend and make them interrupt you.
There is a particular kind of interview that senior engineers dread and juniors misunderstand. Juniors think it is a quiz. Seniors know it is a stress test of how you think when you do not know the answer yet.
What follows is one of those, start to finish. Alex Morgan runs the Backline and Escalation Engineering organisation at Northstar Data Platforms — a (fictional) cloud Data & AI platform whose customers run enormous, expensive, business-critical workloads and phone up when they stop working. Jordan Lee has twenty-two years behind them: data architecture, distributed systems, Spark, Hadoop before that, SQL for longer than that, and a decade of being the person who gets called at 2 a.m.
The role is a staff-level escalation engineer. The interview is four hours. It gets harder as it goes, because Alex has learned that anyone can pass the first thirty minutes.
Before anyone says the word “Spark”, Alex spends fifty minutes finding out whether Jordan can be trusted with an angry customer, a wrong hypothesis, and an engineer who disagrees with them.
The call connects. Alex has two windows open and is not hiding it.
Morning, Jordan. Let's start with something simple. Tell me about yourself.
Happy to. I'll skip the chronology, if that's all right — I'd rather tell you what kinds of problems I've spent my life on.
Three things, mostly. First, large distributed data platforms: designing them, and then being the person who explains why they're behaving badly. Second, production troubleshooting at the layer where Spark meets the JVM meets object storage — the place where the pretty architecture diagram stops helping you. Third, taking what I learn from a single incident and turning it into something that stops thirty incidents.
Scale, since you'll ask: the largest platform I owned end to end ran about eleven petabytes across roughly nine hundred pipelines, four thousand daily Spark applications, peak concurrency of about three hundred jobs. Roughly two hundred internal teams depended on it.
The work I'm proudest of isn't an architecture. It's a diagnostic. We had a recurring class of failure that took a senior engineer two days per incident. I traced it to a shuffle-fetch pattern, wrote the detector, and it turned a two-day investigation into a fifteen-minute one that a first-year engineer could run.
Stop there for a second. You said “I traced it”. Was that you personally, or your team?
Not hostile. Just checking whether the pronoun survives contact.
Fair question. The detection logic was mine — the hypothesis, the event-log parsing, the first ugly version. The productionised service was one of my engineers, and honestly it's better than what I wrote. The thing I'd claim credit for is noticing that the same shape of failure was showing up in tickets that had been filed under six different symptoms.
Good. Most people say “we” when they mean “I” and “I” when they mean “we”, and neither is useful to me.
“I graduated in 2001 and joined a consulting firm, where I worked on…”
Twelve minutes later the interviewer knows your employment history and nothing about your thinking. You have also spent a fifth of the interview on the easiest question in it.
“I'm passionate about big data and I'm a strong team player.”
Unfalsifiable. Nothing in it can be probed, so nothing in it can be believed.
“I've worked with Spark, Kafka, Airflow, dbt, warehouses, lakehouses, Kubernetes, Terraform…”
A tool list is not experience. The next question will be “tell me about the hardest bug you found in one of those”, and the list will not help you answer it.
You've been an architect for years. Principal architect, then head of platform. This job is escalations. It's tickets. Sometimes it's reading a task log at eleven at night because a customer's quarter-end close is failing.
Are you still hands-on? Honestly.
Honestly? Less than I was five years ago, and I've missed it enough to be sitting here.
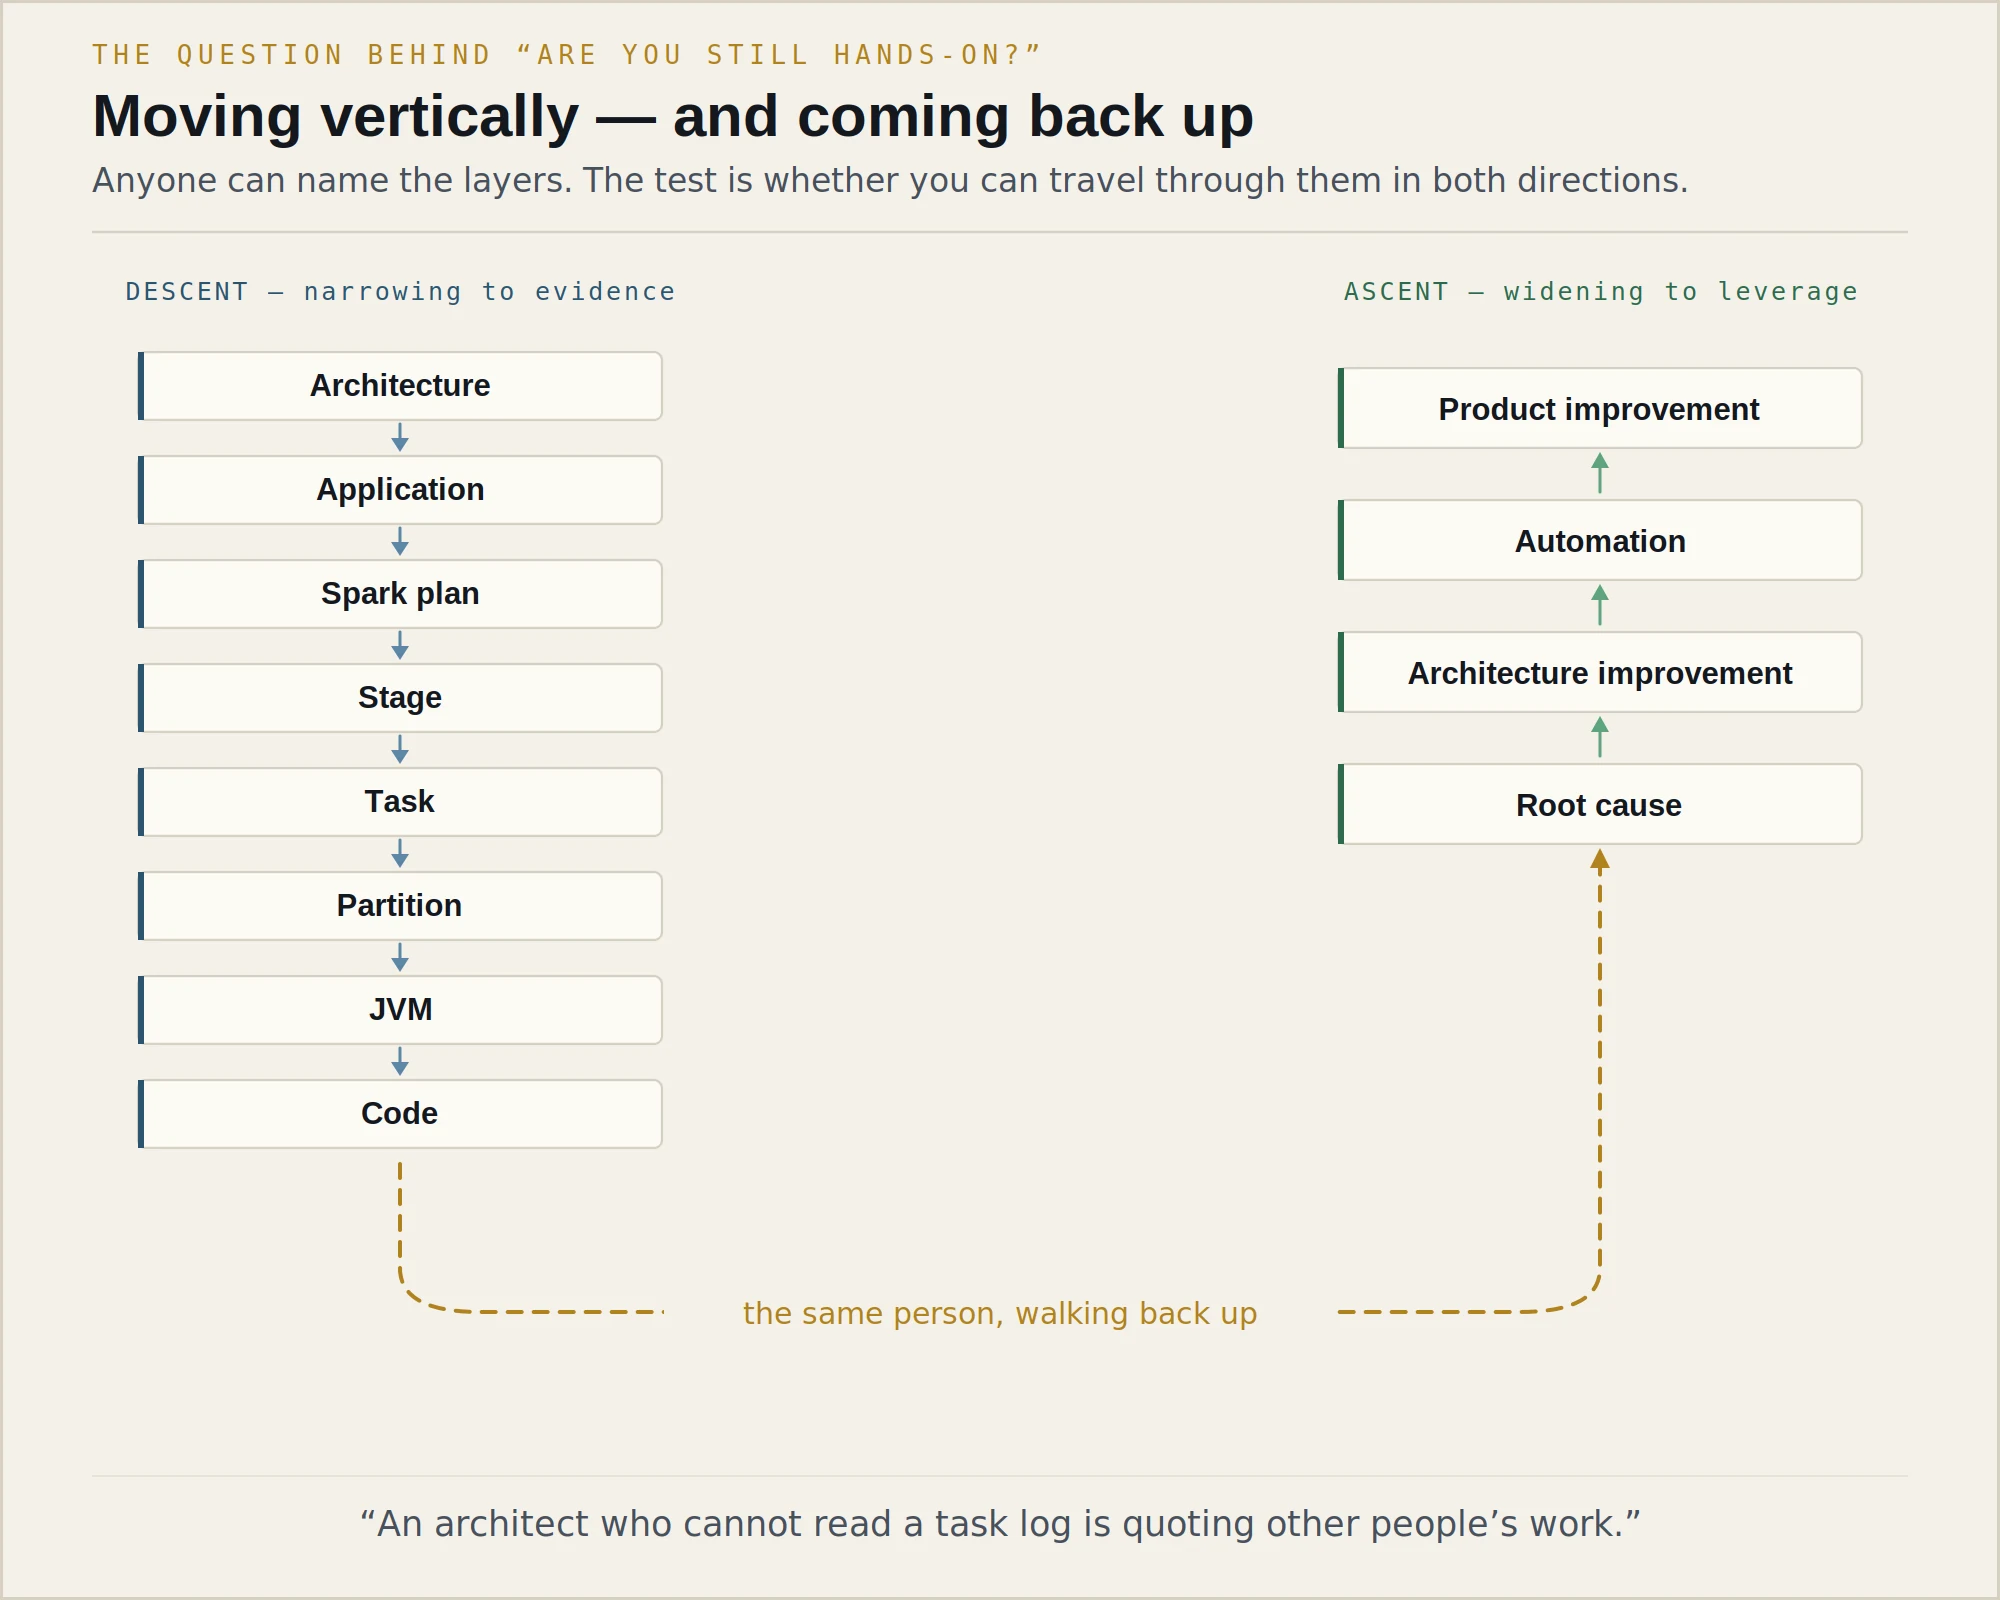
But let me answer the question underneath the question, because I think you're asking whether I can still descend. Architecture rots into slideware the moment you can't verify it. The thing that kept mine honest was being able to go all the way down and come back up.
Jordan shares a screen. It's a diagram they clearly drew themselves, some time ago.
        DOWN — narrowing toward evidence

        Architecture
             |
             v
        Application
             |
             v
        Spark plan
             |
             v
        Stage
             |
             v
        Task
             |
             v
        Partition
             |
             v
        JVM
             |
             v
        Code

        UP — widening toward leverage

        Root cause
             |
             v
        Architecture improvement
             |
             v
        Automation
             |
             v
        Product improvement
The left-hand column is what a good troubleshooter does. The right-hand column is what stops you doing the left-hand column forever.
Plenty of people can do one or the other. The ones who can only descend become heroes who never fix anything permanently. The ones who can only ascend produce recommendations that don't survive contact with a task log. I want a job that requires both, and escalation engineering at a platform company is the only place I've found where both are the same job.
That's a nice diagram. When did you last read a physical plan?
(a beat) Eleven days ago. A cost-attribution job started spilling. I expected a broadcast on the dimension side and got a sort merge instead, because someone had added a filter that the optimiser evaluated after the size estimate. It wasn't my job to fix. I read it because I wanted to know if I still could.
Good. That's the answer I wanted and I notice you didn't give me a rehearsed one.
“Of course I'm hands-on — I review all my team's code.”
Reviewing code is not troubleshooting production. The two skills decay separately.
“I want to get back to the technology and away from politics.”
Escalation work is more political, not less: you are the person standing between an angry customer, a defensive engineering team, and an account manager with a renewal date.
Tell me about a difficult customer situation.
A retail analytics customer — I'll call them Halvorsen Group — had a nightly pipeline that fed store replenishment. It ran at 01:00, finished by 03:30, and buyers acted on it at 06:00. One Tuesday it didn't finish until 11:00, and the stores ordered on stale numbers.
Their VP of Data got on the bridge and opened with: “Your platform broke our production pipeline, and it has cost us about four hundred thousand in misallocated stock.”
What did you say?
I said: “I understand the impact and I'm treating this as a Sev-1. I'm not going to agree with the diagnosis yet, because I don't have evidence for it, and if I agree with the wrong cause we'll fix the wrong thing.”
(leaning in) That's a risky sentence to say to a VP who's just lost four hundred thousand.
It is. It's also the only honest one. The trick isn't the words, it's the split: I acknowledge the impact without accepting the diagnosis. Those are two separate transactions and customers usually only want the first one immediately.
So I split the bridge in two. One track was mitigation — get tonight's run to land before 06:00, whatever it takes, including running it on a bigger cluster we'd eat the cost of. The other track was root cause, which I explicitly said would take days and would not be discussed on this call.
And what was it?
Their upstream vendor had started emitting a new store code — a placeholder for “distribution centre, unassigned”. About forty per cent of the rows carried it. It became the hot key on a join we'd never had trouble with.
So: not our platform. But — and this is the part I insisted on — our platform let it happen silently. The job didn't fail. It just got four times slower with no signal until a human noticed. That was ours. We shipped a data-distribution check on that join, and it caught the same class of thing at two other customers within a quarter.
Did the VP accept that?
Not on day one. On day one they thought I was deflecting. What changed their mind wasn't my explanation — it was that I sent them the key-frequency distribution from before and after, with the date the new code appeared circled. Evidence travels better than apology.
They did also point out, correctly, that we'd sold them a platform that was supposed to notice things like this. Which is why I didn't argue about the four hundred thousand.
        THE TWO TRACKS — never run them on the same call

        Customer reports impact
                |
        +-------+-------+
        |               |
        v               v
   MITIGATION       ROOT CAUSE
   hours            days
   "make it run"    "make it explainable"
   any means        controlled, reversible
   necessary        reproduction
        |               |
        v               v
   Service restored  Evidence
        |               |
        +-------+-------+
                |
                v
        Prevention — the only
        output that reduces
        the next ticket
“I explained to the customer that the issue was on their side.”
Correct and useless. Being right early, loudly, and without evidence is the fastest way to lose an account and a bridge call.
“I apologised and we gave them credits.”
Commercial gesture, zero engineering. Nothing about this answer stops it happening again next quarter.
“We increased the cluster size and it was fine after that.”
This describes the mitigation and calls it the resolution. The forty-per-cent hot key is still there, waiting.
Here's one that matters for this job. Tell me about a time you disagreed with an engineering team. Not a peer — the team who owns the code.
Support believed there was a product defect in a connector. Engineering believed it was customer misuse. Both had been saying so, more loudly each week, for about a month.
Which side were you on?
Neither, and I said so, which made me unpopular in two directions at once.
My position is that I don't escalate opinions. I escalate evidence. What Support had was six customers who were angry. What Engineering had was a strong prior that the connector was fine because it had been fine for two years. Neither of those is a bug report.
So what did you build?
A chain. It's the same chain every time.
   Customer symptom
        "writes intermittently fail with a
         permissions error at high concurrency"
             |
             v
   Minimal reproduction
        one table, 64 concurrent writers,
        30 lines, runs in 4 minutes
             |
             v
   Runtime comparison
        fails on 3 of 5 runtimes,
        passes on 2 — that's a signal, not noise
             |
             v
   Plan / config difference
        the two that pass use a different
        commit protocol default
             |
             v
   Logs
        failure always follows a retry
        after a 503 from object storage
             |
             v
   Code path
        the retry re-issues the request
        without refreshing the credential
             |
             v
   ROOT CAUSE
        token expiry window + retry path
        = real defect, rare, and entirely
          the product's
I gave Engineering the four-minute reproduction and the line number I suspected. The defect was confirmed in a day. It had been an argument for a month and a bug for an afternoon.
And if the reproduction had passed on all five runtimes?
Then Support would have been wrong, and I'd have had to say so — with the same artefact. That's the deal. You don't get to build an evidence chain and then only publish it when it agrees with you.
“I escalated to their director.”
Escalating the org chart is what you do when you cannot escalate the evidence. It works about once.
“Engineering wouldn't listen, so we told the customer to change their code.”
A workaround presented as a resolution. The defect stays in the product and the next six customers find it.
A job that took thirty-five minutes yesterday took two hours and forty-five today. Nobody changed anything. Everybody says that.
Alex shares a screen. A ticket, redacted, with two runtimes on it.
Customer escalation, priority one. A nightly aggregation job. Normal runtime, thirty-five minutes. Last night, two hours forty-five. Same job. The customer says nothing changed.
What do you do?
First thing I do is not touch a configuration.
Why not? You could bump the executor memory and shuffle partitions and it might just go away.
It might. And then I'd have a job that's fast for reasons I can't name, which means I've bought tonight and sold every night after it. At this point, randomly changing Spark configurations would be tuning by astrology.
What I actually want is a diff. Something in the world changed between the thirty-five-minute run and the two-hour-forty-five run. My entire job for the next twenty minutes is to find out what.
   WHAT CHANGED? — the only honest first question

   [ ] Code            new release? new library? notebook edit?
   [ ] Runtime         platform version, connector version, JDK
   [ ] Data volume     more rows? more files? bigger files?
   [ ] Data distribution   same volume, different shape
   [ ] Schema          new column, changed type, new nullability
   [ ] Cluster         size, instance type, autoscaling behaviour
   [ ] Concurrency     who else was running at 01:00?
   [ ] Upstream        did a source system change its output?
   [ ] Storage         region, throttling, lifecycle policy
   [ ] Network         VPC route, endpoint, cross-region read

   Most "nothing changed" incidents are line 4, line 8,
   or line 7 — and the customer is not lying. They are
   answering the question "did YOU change anything".
They come back and tell you: code identical, runtime identical, cluster identical, input row count within two per cent of last week.
Now what?
Good — that's four suspects eliminated and it took one email. Now I want both event logs. The healthy run and the slow one, side by side, and I want to know where the extra two hours went before I have any opinion about why.
Because “the job is slow” is not a symptom yet. It's a category.
   APPLICATION SLOW — decompose before you diagnose
        |
        +-- Driver?            plan compilation, listing,
        |                      collect, scheduling backlog
        |
        +-- Executors?         CPU bound, GC, spill,
        |                      too few, too many, dying
        |
        +-- Shuffle?           volume, fetch failures,
        |                      skewed partitions, spill to disk
        |
        +-- Storage?           read throughput, throttling,
        |                      small files, listing cost
        |
        +-- Network?           cross-AZ, cross-region,
        |                      endpoint saturation
        |
        +-- External?          a metastore, a JDBC source,
                               a rate-limited API

   Two hours went somewhere. Find the somewhere.
   Then, and only then, ask why.
Here's the comparison. Tell me what you see.
                              HEALTHY (Tue)      SLOW (Wed)
  Wall clock                  35 min 12 s       2 h 44 min 58 s
  Total input                 4.1 TB            4.2 TB
  Input files                 61,204            62,880
  Stages                      8                 8
  Tasks (total)               8,412             8,418
  Stage 17 duration           3 min 41 s        2 h 09 min 12 s
  Stage 17 tasks              1,000             1,000
  Shuffle read (stage 17)     612 GB            614 GB
  Max task duration           51 s              31 min 04 s
  Median task duration        29 s              31 s
  Executors                   40                40
  Executor CPU (avg)          71%               9%
  Spill (disk)                0 B               4.4 TB
Right. Several things at once.
One: the extra two hours are almost entirely inside stage 17. Everything else is within noise. So this isn't “the job” being slow — it's one stage, and I can stop thinking about the other seven.
Two: the median task is unchanged. Twenty-nine seconds to thirty-one seconds. That's not a systemic slowdown — if the cluster were starved, or storage were throttling, or the network were degraded, the median would move. It didn't.
Three: the max task is thirty-one minutes against fifty-one seconds, and the average executor CPU has collapsed to nine per cent. Thirty-nine executors are sitting there doing nothing while something finishes.
Four: four point four terabytes of spill that wasn't there on Tuesday.
So it's skew.
(pause) That's my leading hypothesis. I wouldn't call it a conclusion yet.
Why not? Median flat, max thirty-one minutes, CPU on the floor. That's textbook.
It's textbook for a straggler. Skew is one cause of stragglers. So is a single bad node with a degraded disk. So is one executor that lost its locality and is reading across a region. So is a task retrying three times because of a fetch failure and the UI showing me the cumulative time.
All four of those produce “most tasks fine, a few tasks terrible”. They have completely different fixes. If I guess skew and I'm wrong, I'll spend a day salting a key that was never hot.
Fine. How do you tell them apart?
Input bytes per task. It's the cheapest discriminator there is.
If the slow tasks read the same amount of data as the fast ones but take forty times longer, it's environmental — a bad host, a retry, a network path. If the slow tasks read forty times more data, it's the data, and then I go looking at distribution.
Second check: which executors ran the slow tasks. If all three slow tasks landed on one host, I'm suspicious of the host. If they're spread across three hosts, the host is exonerated.
Third: task attempt numbers. Retries inflate durations and I don't want to chase a ghost.
Good. That's the answer I was fishing for. Let me give you the numbers.
“I'd increase spark.executor.memory and set shuffle partitions to 2000.”
Two changes at once, neither derived from evidence, both of which will muddy the next run's comparison. If it gets faster you have learned nothing; if it gets slower you have lost your baseline.
“I'd add more nodes.”
Thirty-nine executors are already idle at nine per cent CPU. Adding more gives the problem a larger audience.
“It's obviously skew.”
Probably. But “obviously” is doing enormous unpaid work in that sentence, and the four candidate causes have four different fixes.
Nine hundred and ninety-seven tasks behaved. Three did not. The interesting question is not what — it's why those three.
Alex pastes a block of numbers into the chat. Three of them are highlighted in red.
  997 tasks
    Duration        25 – 40 sec
    Input           ~600 MB
    Shuffle read    ~590 MB
    Spill           0 B

  3 tasks
    Duration        22 – 31 min
    Input           28 – 43 GB
    Shuffle read    27 – 41 GB
    Spill (disk)    1.3 – 1.9 TB
    Executors       exec-07, exec-22, exec-31
    Attempt         0 (no retries)
What do you think?
My first hypothesis is skew, and now I've got support for it rather than a hunch. Three different executors, so it isn't a bad host. Attempt zero, so it isn't retries. And the slow tasks read fifty to seventy times more data than the fast ones — so it's not environmental, it's the partitioning.
But I want to be careful about the word “skew”, because it's a description of the symptom, not the cause. Something put twenty-eight to forty-three gigabytes into three partitions. I want to know what.
Salt the key and move on. Twenty minutes of work, job's back to thirty-five minutes, customer's happy.
This is a trap and both of them know it.
I might well end up there. But salting is an answer, not a diagnosis, and I'd be embarrassed to reach for it before I know which key is hot and why.
Here's my worry. Suppose the hot key turns out to be null. Salting spreads nulls across two hundred partitions and the job gets faster — and we have just spent compute distributing rows that were never going to match anything on the other side of the join. The correct fix is a filter, and it makes the job faster than salting ever would.
Or suppose the hot key is a real, legitimate customer who is genuinely forty per cent of the data. Then salting is right, and it's right permanently, and I should build it into the pipeline rather than patch it.
Or suppose the join is exploding — the “skew” is on the output side, not the input side, because a one-to-many relationship became one-to-many-thousands. Salting does nothing for that at all.
Three causes. Three different fixes. Same symptom.
So how do you find out? You've got a customer waiting.
It's one query, and it runs on a sample.
SELECT  customer_id,
        count(*)                             AS rows,
        count(*) * 100.0 / sum(count(*)) over () AS pct
FROM    fact_transactions
WHERE   event_date = '2026-09-02'
GROUP BY customer_id
ORDER BY rows DESC
LIMIT   20;

-- and the one people forget:
SELECT count(*) FILTER (WHERE customer_id IS NULL)      AS nulls,
       count(*) FILTER (WHERE customer_id = 'UNKNOWN')  AS unknown,
       count(*) FILTER (WHERE customer_id = '-1')       AS sentinel
FROM   fact_transactions
WHERE  event_date = '2026-09-02';
Here's what comes back.
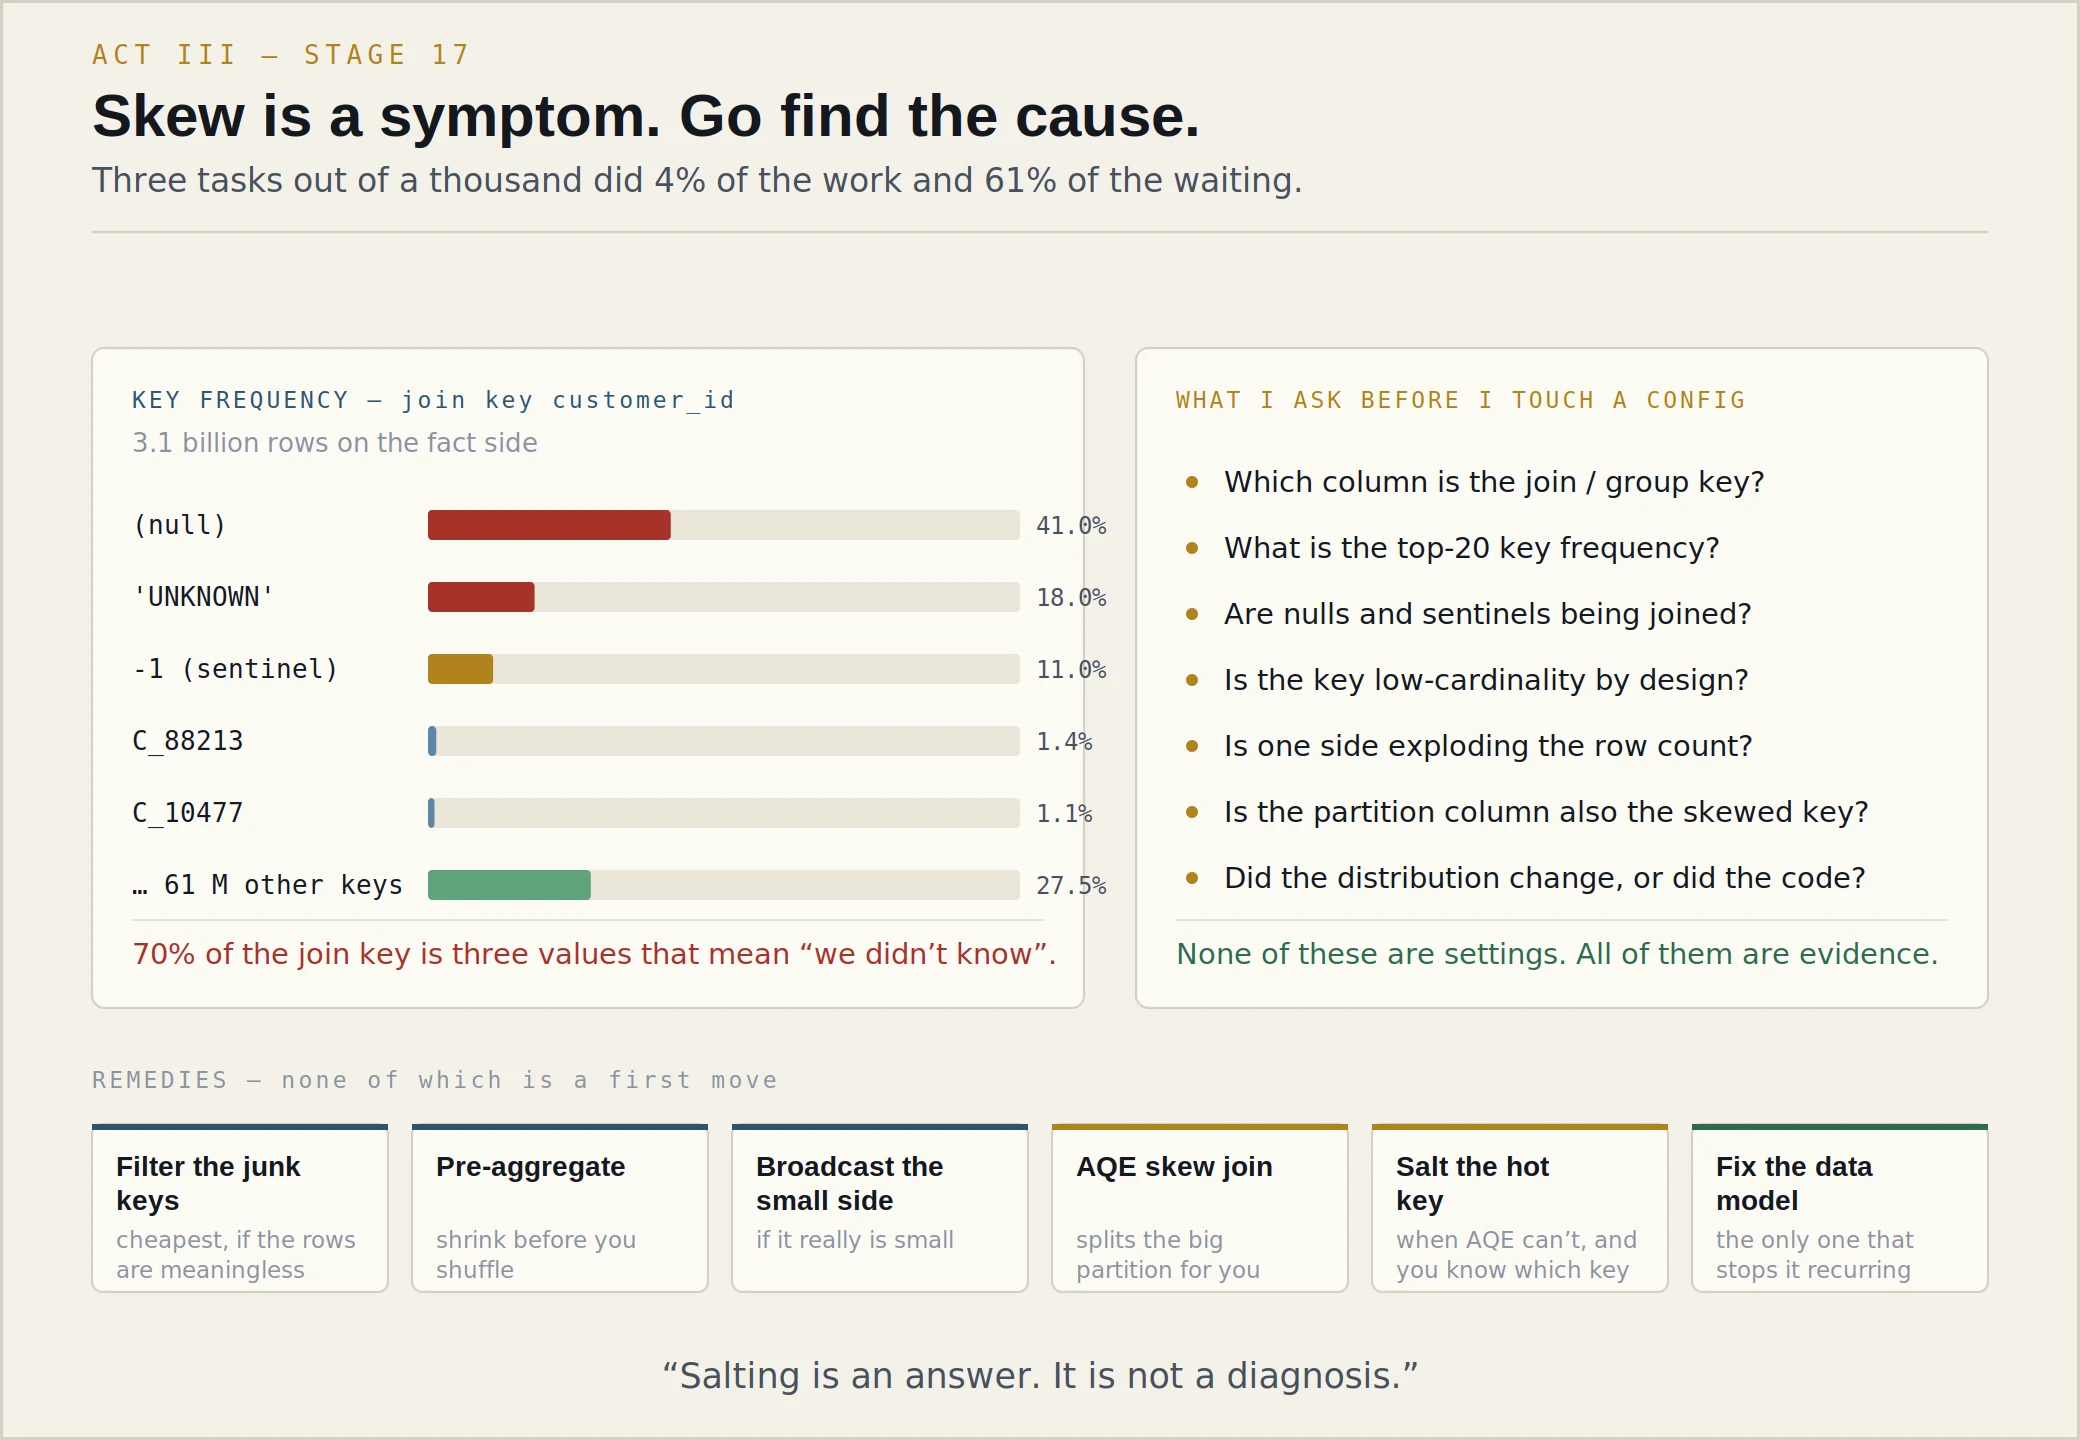
(quietly) Well. That changes my hypothesis.
Forty-one per cent null, eighteen per cent the literal string UNKNOWN, eleven per cent minus-one. That's not skew in the interesting sense. That's three generations of “we don't have this value” conventions living in one column, and a join that is dutifully shuffling all of them to three partitions.
You said “that changes my hypothesis”. Changes it to what?
To a data-quality problem wearing a performance costume.
And it also changes the question I want to ask the customer, which is now: what is the join supposed to do with those rows? Because if the dimension table has no row for null, no row for UNKNOWN, and no row for minus-one — and it almost certainly doesn't — then seventy per cent of the shuffled volume is being moved across the network in order to match nothing.
An inner join drops them after the shuffle. A left join keeps them with nulls on the right, which they could have had without going anywhere.
Careful. What if the customer's business logic needs those rows in the output?
Then they need them — but they still don't need them in the join. Split the frame: the rows with a resolvable key go through the join, the rows without one bypass it and get unioned back on with the null-filled columns they were always going to get. Same output, seventy per cent less shuffle.
That's the fix I'd propose. And I'd want to say out loud that it's a code change on their side, not a setting, which means it doesn't land tonight.
So what lands tonight?
Tonight I'd verify that adaptive execution is actually enabled and that skew join handling is on, because if it's off — and on older configurations it often is — turning it on may split those three partitions automatically and buy the customer their morning back. That's mitigation, it's reversible, it's one setting, and I can explain exactly what it does.
Then tomorrow we have the conversation about the data model.
And if AQE is already on and it didn't help?
Then I want to know why, because that's interesting. Adaptive skew handling splits a partition that's large relative to the median — but it can only split it if the work is splittable. If the downstream operation is an aggregation on that key, you can split the input all you like; the results still converge on one reducer. And if the statistics that AQE uses came from a stage whose sizes were themselves computed before a filter, the partition may not look skewed to the optimiser even though it is.
Which is a long way of saying: if AQE didn't fix it, I stop trusting my mental model and go and read the plan.
| If the distribution shows… | The fix is… | And salting would… |
|---|---|---|
| Nulls / sentinels dominate | Filter or bypass them before the join | Work, expensively, forever |
| One legitimate mega-customer | Salt, or broadcast the other side, permanently | Be correct — build it in, don't patch it |
| Low-cardinality key by design | Change the join key, or pre-aggregate first | Add complexity without fixing the design |
| Exploding join (1:many→1:millions) | De-duplicate the right side; check the grain | Do nothing at all |
| Dimension is small after filtering | Broadcast it; the shuffle disappears | Be unnecessary |
| Distribution genuinely unchanged | Stop. Your hypothesis is wrong; go back to the diff | Waste a day |
“Use salting.”
Offered as a first move, before the distribution is known, this is a memorised answer to a question that hasn't been asked yet. It is right often enough to be dangerous.
“Enable AQE.”
Fine as mitigation, offered with a mechanism. Offered as a resolution, it means “I hope the platform fixes this for me and I won't know if it doesn't.”
“Repartition the dataframe.”
Repartitioning on the same skewed key produces the same skewed partitions, plus a shuffle you paid for.
“Increase shuffle partitions to 10,000.”
Nine hundred and ninety-seven tasks were already fine. This makes them smaller and more numerous, and does nothing whatsoever to the three that matter — all the rows with the same key still land in one partition.
Alex stops asking about incidents and starts asking about mechanism. This is where memorised answers come apart.
Let's back up a level. I write this:
SELECT  d.region,
        count(*)          AS txns,
        sum(f.amount)     AS revenue
FROM    fact_transactions f
JOIN    dim_customer d  ON f.customer_id = d.customer_id
WHERE   f.event_date BETWEEN '2026-08-01' AND '2026-08-31'
  AND   d.segment = 'ENTERPRISE'
GROUP BY d.region;
Walk me through what Spark does with that. Don't lecture me. I'll interrupt.
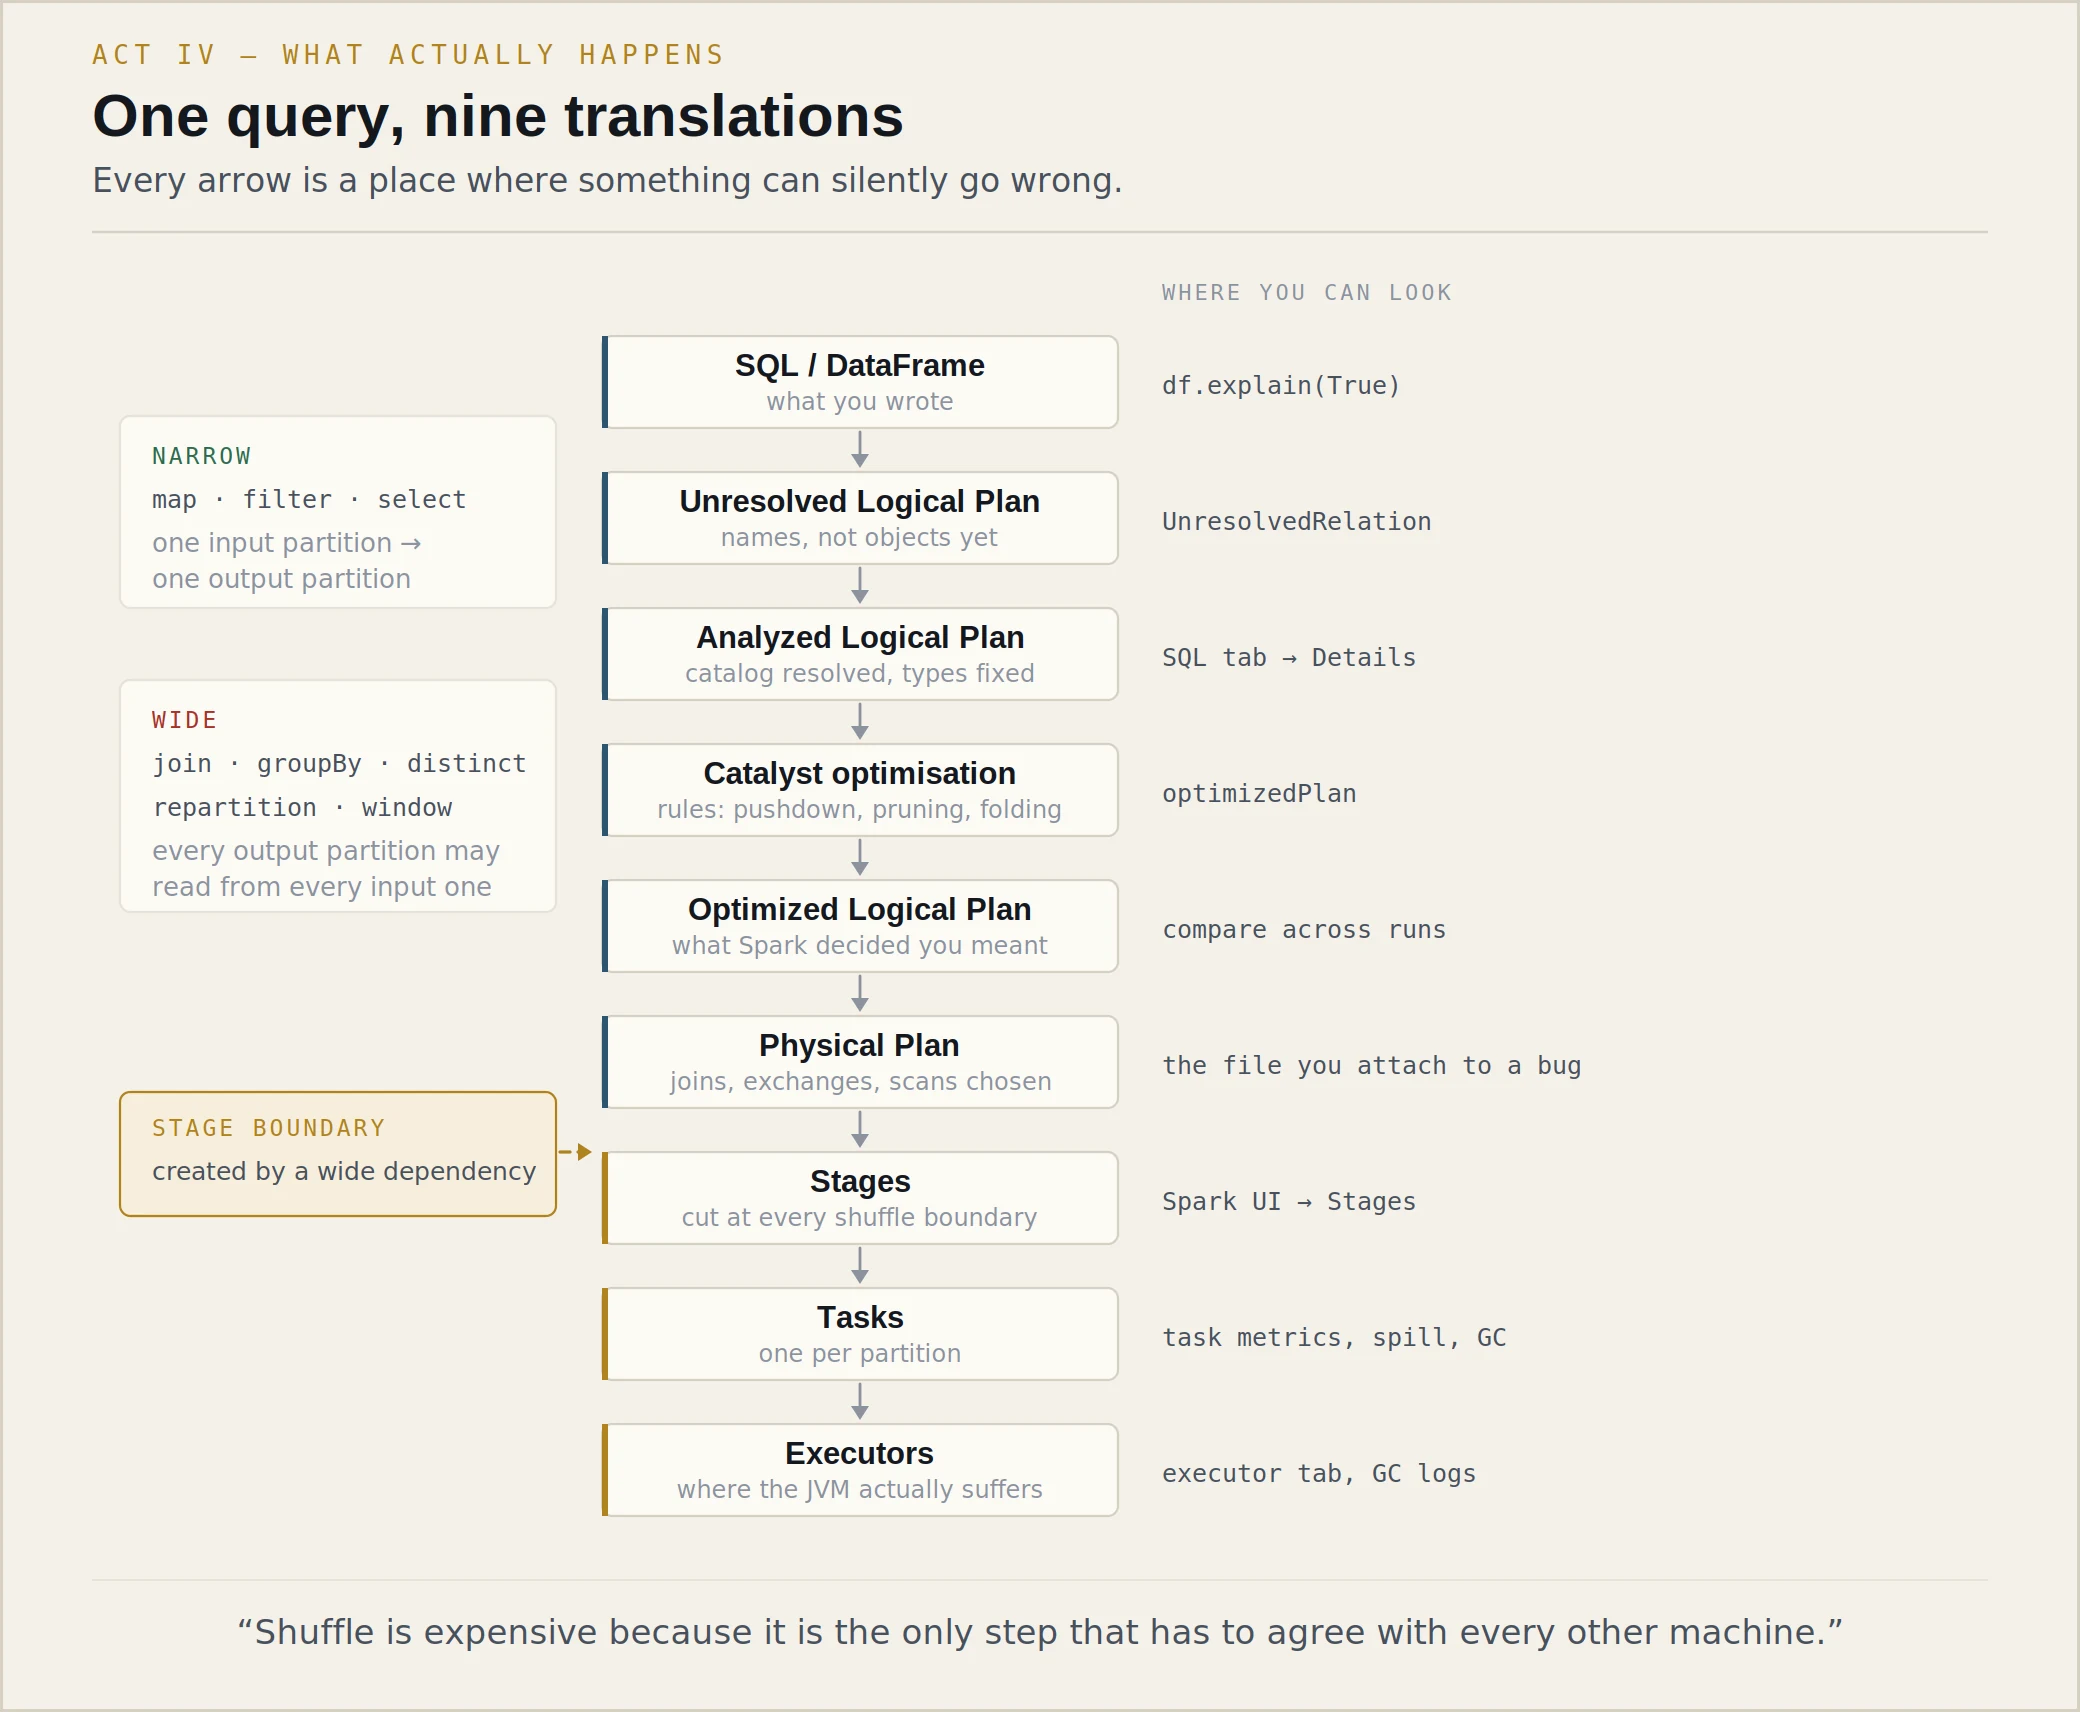
Sure. The text gets parsed into an unresolved logical plan — a tree where fact_transactions is just a name. Nobody has checked it exists, nobody knows what amount is.
The analyzer resolves those names against the catalog. Now the relations are real, the columns have types, and if d.segment doesn't exist this is where you find out.
Then Catalyst optimises: a rule-based pass and, for the join decisions, cost estimates. Predicate pushdown moves the date filter down to the scan so the reader can skip files. Column pruning means we only read customer_id, amount, event_date instead of the whole row. Constant folding, filter reordering, and so on.
Out comes the optimized logical plan — which is worth saying is Spark's opinion about what you meant, and it is not always the same as what you meant.
The planner turns that into a physical plan: which join algorithm, which aggregate implementation, where the exchanges go. Then the DAG scheduler cuts the physical plan into stages at every shuffle boundary, each stage becomes a set of tasks — one per partition — and the task scheduler puts those on executors.
Stop. What exactly causes a stage boundary?
A wide dependency. Which is a precise thing, not a vibe: it's when a single output partition may need data from more than one input partition.
A filter is narrow — partition seven in, partition seven out, no coordination with anybody. A map is narrow. A select is narrow. You can chain forty of them and Spark will fuse them into one stage and run them as a single pass over the data, because no task ever needs to know what any other task is doing.
A groupBy is wide, because the rows for region = 'EMEA' are scattered across every input partition and they all have to end up in the same place. A join on a key is wide for the same reason. So is distinct, so is a window function with a partition-by, so is an explicit repartition.
The boundary exists because the data has to be physically redistributed, and that redistribution can't start until the previous stage has finished producing its output. That's why it's a barrier, and that's why one slow task holds up a thousand fast ones.
Why is shuffle expensive? Give me the actual costs, not “because network”.
Four costs, and network is the one people over-weight.
First, serialisation. Every row that crosses a shuffle gets written out in a serialised form and read back. That's CPU on both ends and it's often the largest single component.
Second, disk. Map tasks write shuffle output to local disk. If the data doesn't fit in the memory buffer, you sort and spill, and now you're doing merge passes.
Third, the network transfer itself, which is all-to-all. A thousand map tasks and a thousand reduce tasks is a million logical fetches. It's not one big transfer; it's a very large number of small ones, and the small ones are what hurts.
Fourth — and this is the one that separates a slow job from a failed job — it's a synchronisation barrier. The whole stage finishes when the slowest task finishes. Everything else is just waiting, and paying for the privilege.
If Spark has adaptive query execution, why would anyone ever manually salt a key?
Alex asks this in the tone of someone who has heard a bad answer to it recently.
Because AQE is reactive and it works on the shape of the data it can measure, at the moment it can measure it.
It re-optimises between stages using real shuffle statistics — that's the whole trick, and it's a good one. It can coalesce hundreds of tiny partitions into sensible ones, switch a sort merge join to a broadcast when the built side turns out to be small, and split an oversized partition for a skewed join.
But: it splits skewed partitions relative to a median and a threshold, so a partition that's ten times the median may be handled while one that's four times the median isn't — and four times can still be your critical path. It can't split work that fundamentally converges, like a single-key aggregation. It reacts after a stage has already been written, so you've paid for the bad shuffle before it helps you. And on the first, biggest join of a pipeline there may be no prior statistics to react to.
So AQE is where I start, not where I stop. Manual salting is what I do when I know the specific key, I know it's stable, and I want a deterministic plan instead of a hopeful one. That is a rarer situation than the internet suggests.
Where do you see the difference between the logical and the physical plan?
explain(True) if I'm in a notebook, or the SQL tab in the UI if I'm looking at somebody else's run — and for an escalation it's almost always somebody else's run, so it's the SQL tab and the event log.
The thing I look for first isn't the plan, actually. It's the exchange nodes. Count them, and look at what's above each one. That tells me where the money went.
“Spark builds a DAG and executes it lazily.”
True and empty. It answers a question about vocabulary, not about mechanism, and the next question will expose that.
“A stage boundary happens at an action.”
Conflates jobs with stages. An action triggers a job; wide dependencies cut that job into stages.
“AQE handles skew, so salting is obsolete.”
Believing your platform's marketing about your platform is a specific professional hazard in this role.
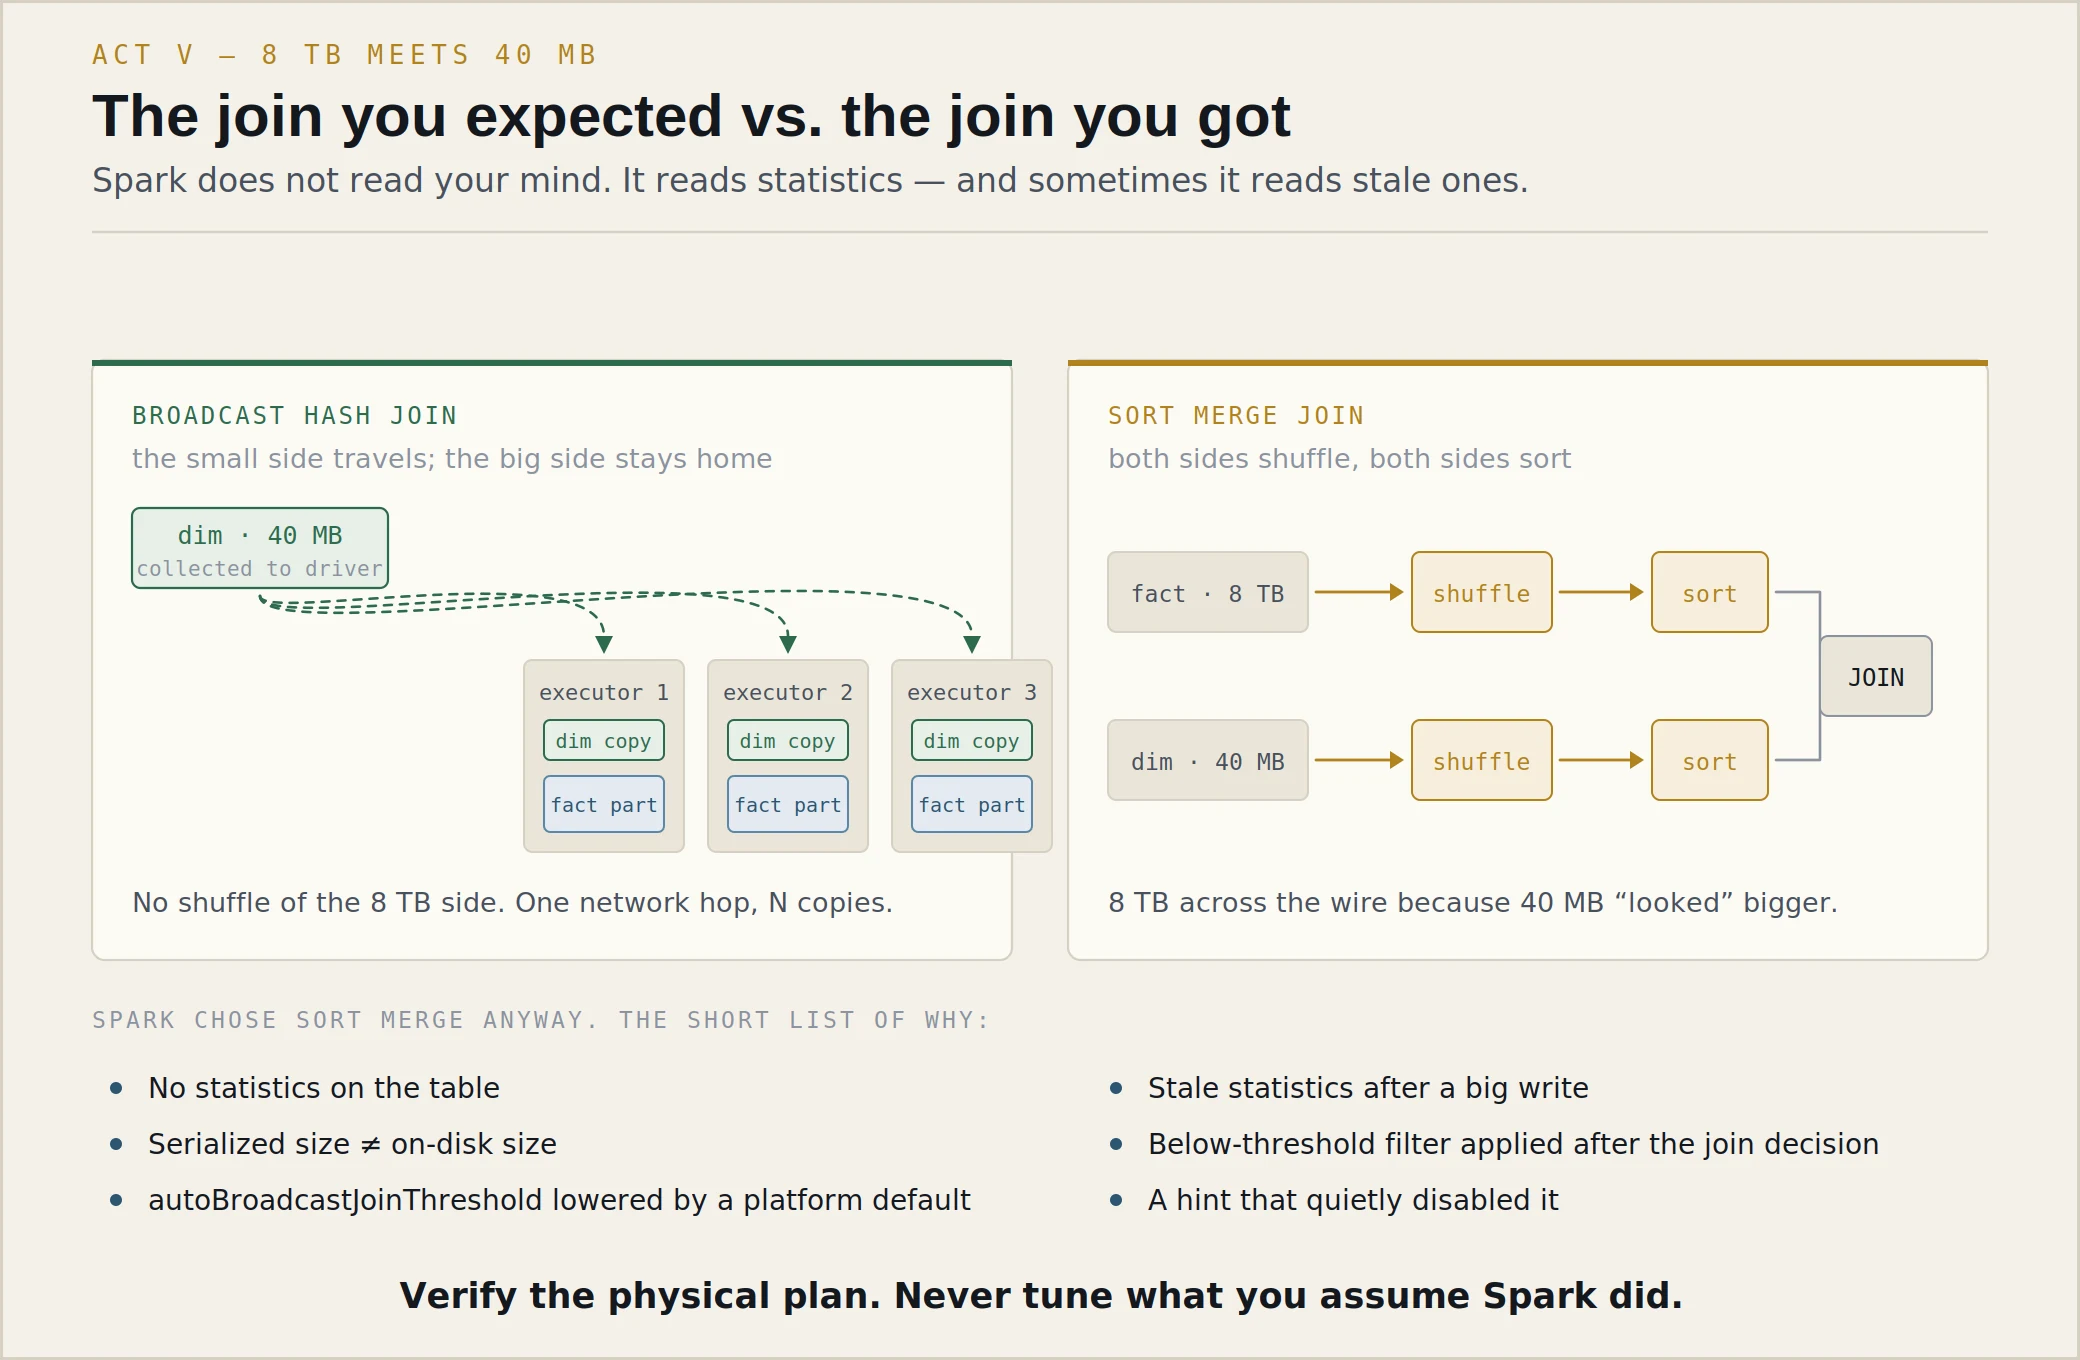
The join everyone expects, the join Spark actually chose, and the six reasons for the gap.
Fact table: eight terabytes. Dimension table: forty megabytes after the filter is applied. Inner join on a single key. What join would you expect?
Broadcast hash join, obviously — the small side gets collected to the driver, shipped once to every executor, built into a hash table in memory, and then each executor probes it with its own local slice of the fact table. The eight terabytes never moves. That's the whole point.
Spark chose sort merge join anyway. Why?
Jordan does not answer immediately.
I don't know yet, and I'd want to see the plan before I speculate. But I can tell you the shortlist I'd work through, in order of how often it's the answer.
One: no statistics. If the table has never been analysed and the format doesn't carry reliable size metadata, the optimiser falls back to a default size estimate — and the default is deliberately enormous, so nothing gets broadcast. This is the answer maybe half the time.
Two: the filter is applied after the estimate. This one catches everyone. The dimension is forty megabytes after segment = 'ENTERPRISE'. If the optimiser's size estimate is based on the table and its selectivity guess for that predicate is wrong — or the predicate is on a column with no statistics — it may believe the built side is four gigabytes rather than forty megabytes.
Three: stale statistics. Somebody analysed the table when it had two hundred rows in it, then loaded a year of data, and nobody re-analysed.
Four: serialised size versus stored size. Forty megabytes of compressed Parquet can be several hundred megabytes as deserialised Java objects in a hash table. If it's near the threshold on disk, it isn't near the threshold in memory, and the estimate the optimiser uses may be either.
Five: the threshold was lowered. Platform teams sometimes reduce the broadcast threshold globally because a driver went out of memory once. Then everything sort-merges and nobody remembers why.
Six: a hint, or the join type. A full outer join can't be broadcast. Nor can most joins where the side you'd need to broadcast is the side that must be preserved.
Pick one. You've got one API call.
I'd look at the plan and read the sizeInBytes the optimiser assigned to the built side. That single number tells me whether I'm arguing with a statistics problem or a threshold problem, and those are different conversations.
If it says eight exabytes — and it will say something absurd like that if there are no statistics — I'm in case one, and the fix is to collect statistics rather than to fight with hints.
== Physical Plan ==
*(5) HashAggregate(keys=[region], functions=[count(1), sum(amount)])
+- Exchange hashpartitioning(region, 200)
   +- *(4) HashAggregate(keys=[region], functions=[partial_count, partial_sum])
      +- *(4) Project [region, amount]
         +- SortMergeJoin [customer_id], [customer_id], Inner
            :- Sort [customer_id ASC], false, 0
            :  +- Exchange hashpartitioning(customer_id, 200)   <-- 8 TB moves
            :     +- FileScan parquet fact_transactions[...]
            :        PushedFilters: [event_date >= 2026-08-01, ...]
            +- Sort [customer_id ASC], false, 0
               +- Exchange hashpartitioning(customer_id, 200)
                  +- Filter (segment = ENTERPRISE)
                     +- FileScan parquet dim_customer[...]
                        Statistics(sizeInBytes=8.0 EiB)          <-- there it is
There. Eight exabytes. That's the “I have no idea how big this is” value — the optimiser's way of saying it has no statistics and is refusing to guess low.
So the mechanism is: no statistics, therefore a maximal size estimate, therefore no broadcast, therefore eight terabytes crosses the network for no reason at all.
So you'd add a broadcast hint and close the ticket.
I'd add a broadcast hint to prove the mechanism, run it once, and watch the runtime collapse. That's the experiment.
But I wouldn't ship the hint as the fix, and I definitely wouldn't close the ticket with it. A hint fixes one query. Missing statistics is a property of the table, and there are forty other queries against that dimension, all of them making the same bad decision quietly.
The fix is statistics collection on that table, and the interesting question — the escalation-engineer question — is why a table in a managed platform ended up with none. If it's because their ingestion path writes in a way that skips statistics, that's a product conversation, not a customer conversation.
What if adding the broadcast hint makes the driver run out of memory?
Then my forty-megabyte assumption was wrong and I've learned something valuable for free. Broadcasting collects the built side to the driver first. If it OOMs there, the built side isn't forty megabytes — either the filter isn't as selective as we thought, or it's being applied after the collect, or the deserialised form is far larger than the stored form.
That failure is more informative than the success would have been. It also tells me not to be smug about case four on my list.
sizeInBytes on the built side” is a plan of action.“Spark should have broadcast it. That's a Spark bug.”
Spark did exactly what the statistics told it to. The bug, if there is one, is upstream of the optimiser.
“I'd raise the broadcast threshold to 1 GB.”
Against an eight-exabyte estimate, no threshold is high enough. This answer proves the mechanism was never understood.
“I'd add broadcast hints everywhere.”
Now every driver in the fleet is one oversized dimension away from an out-of-memory error, and the plans have stopped adapting to data that changes.
Nearly half of a task's life spent collecting garbage. The obvious conclusion is available, cheap, and not yet earned.
  Task run time            900 s
  JVM GC time              410 s          (45.6% of task time)
  Peak execution memory    11.2 GB
  Spill (memory)           26.1 GB
  Spill (disk)             18.4 GB
  Shuffle read             9.8 GB
  Records read             412,880,114
  Executor heap            16 GB
  Cores per executor       4
So it's GC?
GC is definitely expensive.
That wasn't my question.
Right. No — I haven't proven GC is the root cause.
Good. Continue.
Here's how I'd put it. GC is telling me that memory is suffering. It isn't telling me why memory is suffering, and it's the “why” that has a fix attached to it.
And look at the other numbers, because they're louder than the GC one. Eighteen gigabytes of disk spill and twenty-six gigabytes of memory spill, on a task with a sixteen-gigabyte heap. That task is trying to hold something that does not fit, and the JVM is doing what a JVM does when you ask it to hold something that doesn't fit: it collects, frantically, and then it gives up and writes to disk.
The GC time is a consequence. If I hand this to someone who's been told “high GC means increase the heap”, they'll double the executor memory, the spill will halve, the job will get twenty per cent faster, everyone will call it fixed, and the actual problem — whatever is putting nine point eight gigabytes of shuffle into one task — will still be there next quarter with more data behind it.
Giving it more heap would help though.
It would help. Giving a leaking application another thirty-two gigabytes of heap may delay the funeral. It doesn't cure the patient.
And it isn't free either — bigger heaps mean longer pauses on a full collection, and on this instance type it means fewer executors, which means less parallelism. The “just add memory” move has a cost that shows up two weeks later on the bill and in the p99.
All right. Walk me through what you'd actually do. In order.
Eight steps, and the first four are free.
   1  Spark UI / event log first
      Which stage, which tasks, which executors.
      GC on ONE executor is a different problem
      from GC on ALL of them.

   2  GC time as a fraction of task time
      45% is pathological. 5% is normal.
      But compare against the healthy run —
      "high" is relative to yesterday.

   3  Spill, memory and disk
      Spill is the JVM telling you, in Spark's
      own words, that the working set does not fit.

   4  Partition size
      Input bytes and records per task. If one
      task holds 40x the data, memory is not the
      problem. Partitioning is the problem.

   5  Executor concurrency
      4 cores per executor = 4 tasks sharing one
      heap. The heap isn't 16 GB per task; it is
      16 GB divided by however many tasks are
      running, minus storage memory, minus overhead.

   6  Collect GC logs
      -Xlog:gc* — now you have a timeline instead
      of a single aggregate number.

   7  Heap occupancy before and after each GC
      This is the whole diagnosis. See below.

   8  Correlate GC with Spark stage behaviour
      Does the GC storm start when stage 23 starts?
      When the build side is constructed? When the
      spill begins? The correlation names the cause.
Say we're at step six. How do you turn GC logging on, and what do you ask for?
Modern JVMs use unified logging, so it's the -Xlog family rather than the old scattered flags. Minimum viable:
# the smallest thing that is still useful
-Xlog:gc*

# what you actually want in production: a file, with
# timestamps, so you can line it up against stage times
-Xlog:gc*:file=/tmp/gc.log:time,uptime,level,tags

# and, because executors are cattle, keep it bounded
-Xlog:gc*:file=/tmp/gc-%p.log:time,uptime,level,tags:filecount=5,filesize=20M

# set via the platform's executor JVM options, e.g.
spark.executor.extraJavaOptions = -Xlog:gc*:file=/tmp/gc-%p.log:time,uptime,level,tags
The %p matters more than it looks — one file per process, or forty executors overwrite each other and you spend an hour discovering that.
And the timestamps matter because a GC log on its own is a shapeless pile of pauses. A GC log aligned to stage start times is a diagnosis.
Fine. You've got the log. What are you reading for?
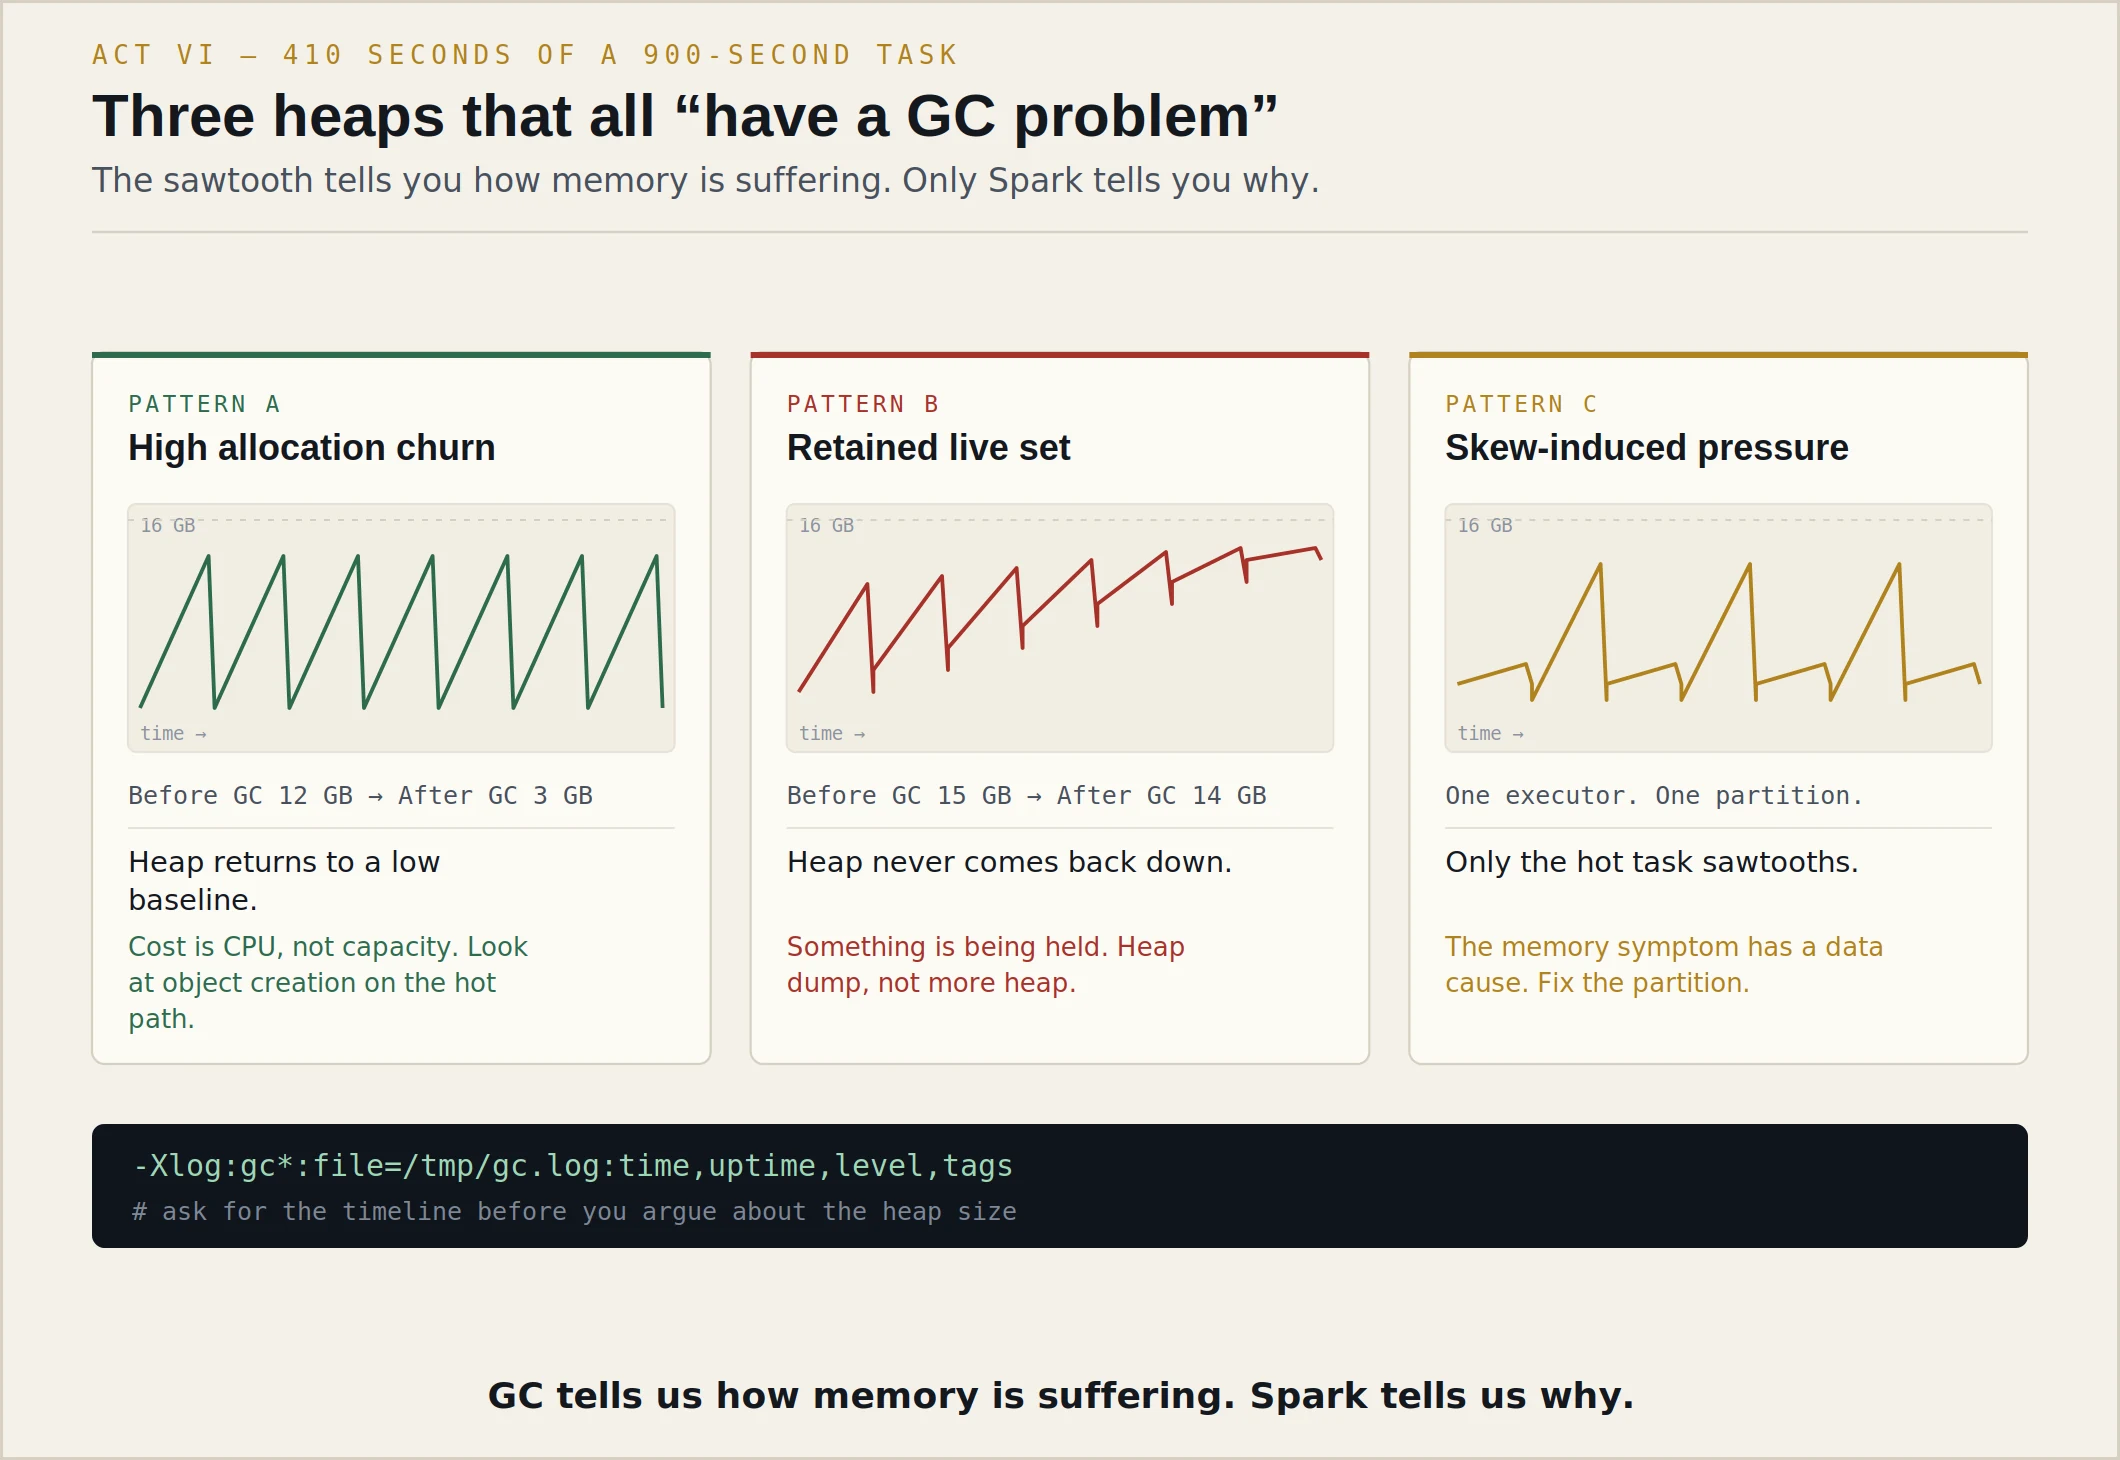
Occupancy before and after each collection. Not pause duration — that's the symptom everyone quotes. Occupancy is where the meaning is.
Two logs can have identical GC time and mean completely opposite things.
  Before GC:  12 GB
  After GC:   3 GB
  Heap:       16 GB

  Nine gigabytes reclaimed. Every time.
  The application is creating enormous numbers of
  short-lived objects and throwing them away.

  Cost is CPU, not capacity. More heap buys you
  slightly fewer, slightly longer collections.
  The fix is upstream: fewer objects on the hot path.
  Before GC:  15 GB
  After GC:   14 GB
  Heap:       16 GB

  One gigabyte reclaimed out of fifteen. The
  collector is working hard and achieving nothing,
  because the objects are still reachable.

  This is not a tuning problem. Something is HOLDING
  memory — a cache, a giant hash table, an unbounded
  accumulator, a broadcast that shouldn't have been.
  More heap postpones it by exactly one dataset size.
Which one is our executor 19?
I'd bet on a third pattern, and I'd want the log to tell me rather than my bet.
Given eighteen gigabytes of disk spill and nine point eight gigabytes of shuffle read on one task, I'd expect to see the heap oscillating hard — allocating a large hash table for the join or the aggregation, filling it, spilling, allocating again — with post-GC occupancy that climbs while the build is happening and then drops when the spill completes. That's pattern A and pattern B taking turns, driven by pattern C.
   PATTERN C — the one that actually explains most Spark GC storms

        Hot key
           |
           v
        Huge partition          one task gets 40x the rows
           |
           v
        Large hash table        build side sized by the data
           |                    it was handed, not by config
           v
        Allocation pressure     the heap can't hold it
           |
           v
        GC                      the collector runs constantly,
           |                    reclaiming almost nothing
           v
        Spill                   Spark gives up and goes to disk
           |
           v
        Slow task               and the other 999 tasks wait

   Note the direction of the arrows. GC is in the MIDDLE
   of this chain. Tuning the middle of a causal chain is
   how you get a job that is 20% faster and still wrong.
Suppose I tell you the GC log shows post-collection occupancy at fourteen gigabytes and climbing, steadily, across the whole application. Every executor. Not just this one.
(sits back) Then I was wrong, and it's more interesting than skew.
Climbing post-GC occupancy on every executor, across the whole application, isn't a partitioning problem — partitioning problems are localised to the tasks with the big partitions. That's a retained live set, which means something is accumulating that shouldn't be.
Candidates: a cached dataframe that nobody unpersisted and that grew with the data. A broadcast variable being rebuilt per batch and held. An accumulator collecting per-row values. A user-defined function holding a static collection — I've seen a memoisation cache in a UDF that was keyed on a customer id, which is exactly as bad as it sounds. Or, less often but it happens, a connector holding response buffers.
And at that point I stop reading GC logs, because they've done their job. They've told me memory is being retained. To find out what is retaining it I need a different instrument.
| Signal | Most likely interpretation | Next instrument |
|---|---|---|
| High GC + one huge partition | Data skew creating execution pressure | Key distribution query |
| High GC + heap returns to a low baseline | Allocation churn — CPU cost, not capacity | Allocation profile (JFR) |
| High GC + rising post-GC occupancy | Retained objects — something is holding | Heap dump |
| Executor disappears, heap looked normal | Container / native memory, not the heap | Container kill logs, off-heap accounting |
| Low CPU + high storage latency | I/O bound — you are waiting, not working | Storage metrics, thread dump |
| 999 fast tasks + 1 slow task | Skew or straggler — not yet distinguished | Input bytes per task |
| All tasks uniformly 3x slower | Environmental: cluster, network, throttling | Compare the healthy run's environment |
“GC time is 45%, so increase executor memory.”
The most common wrong answer in this discipline. Sometimes it works, which is what makes it so durable.
“Switch the collector to G1 / ZGC / something newer.”
Collector choice matters, at the margin, once you know whether you have churn or retention. As a first move it is a coin flip with extra steps.
“Reduce the number of cores per executor.”
A real and sometimes correct lever — fewer concurrent tasks per heap. But offered without evidence, it is another blind change, and it costs parallelism across the whole application to fix three tasks.
“Cache the dataframe so it doesn't recompute.”
Adding storage memory pressure to an executor that is already spilling. This makes it worse and is offered surprisingly often.
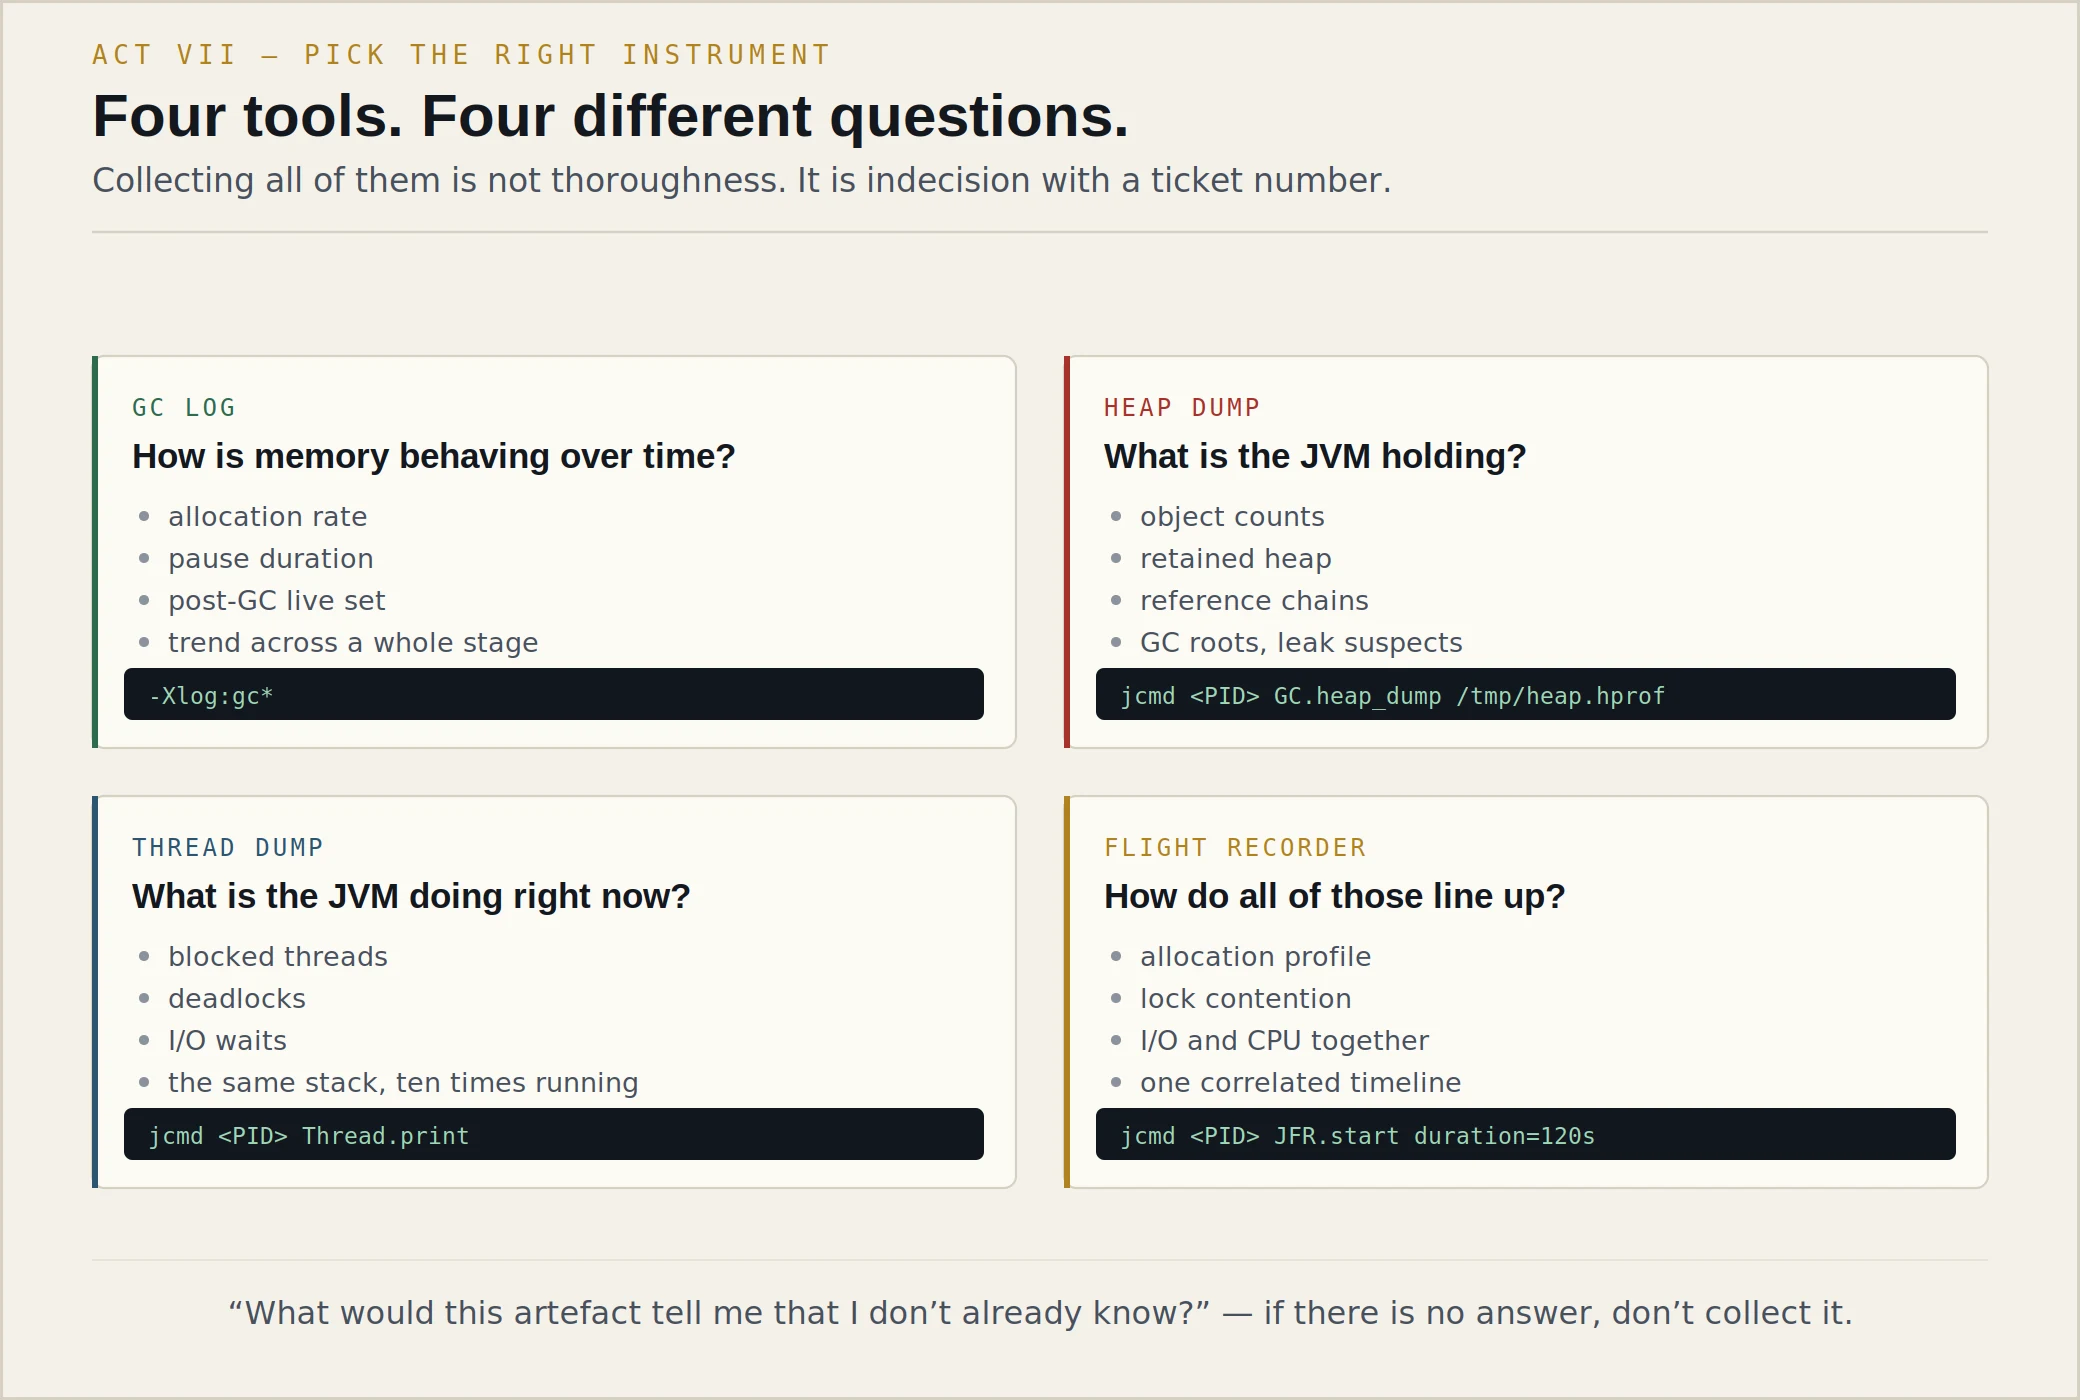
Collecting everything is not thoroughness. It is indecision with a ticket number attached.
When would you take a thread dump?
To find out what the JVM is doing.
Specifically: when a process is alive but not progressing. CPU is low, nothing is failing, tasks are just… not finishing. That's a thread dump question, because the answer is almost always that threads are parked somewhere and I want to see where.
And what do you look at when you have one?
Blocked threads and what they're blocked on. Deadlocks — the JVM detects most of them for you and says so at the bottom, which people miss. Threads in I/O wait, because that tells me I'm waiting on storage or a service rather than computing. Lock contention, where forty threads are queued on one monitor.
And the single most useful trick: take three dumps, ten seconds apart. One dump is a photograph and photographs lie. Three dumps tell you whether a stack is stuck or merely busy. If the same thread is at the same line in all three, that's your answer. If they're all different, the JVM is working and your problem is elsewhere.
When would you take a heap dump?
To find out what the JVM is holding. Which is a different question, and I'd want to have already established from the GC log that something is being held — pattern B from before, post-collection occupancy that climbs and stays.
Then: object counts, retained heap rather than shallow size, reference chains back to a GC root. The question I'm answering is “what is keeping this alive?”, and the reference chain is the only thing that answers it.
What's the cost? Because you're going to ask a customer to do this on a production cluster.
That's the right question and it's the reason I don't ask for one casually.
A full heap dump stops the world for as long as it takes to write the heap to disk. On a sixteen-gigabyte heap that's tens of seconds of complete freeze, and it produces a file that then has to get off the executor and to me — which on a container that may be killed for being unresponsive is not guaranteed. You also just handed yourself a file containing the customer's actual data, which has consequences I need to have thought about before I ask, not after.
So: heap dump is a deliberate, scheduled act with a named hypothesis. Not a reflex.
# what is it doing right now — cheap, safe, take three
jcmd <PID> Thread.print

# what is it holding — expensive, stops the world, ask first
jcmd <PID> GC.heap_dump /tmp/heap.hprof

# a cheaper first look: a class histogram, no full dump
jcmd <PID> GC.class_histogram

# heap geometry and collector state, near zero cost
jcmd <PID> GC.heap_info

# the correlated timeline — low overhead, run it during the bad window
jcmd <PID> JFR.start name=esc duration=120s filename=/tmp/esc.jfr settings=profile
jcmd <PID> JFR.dump  name=esc filename=/tmp/esc.jfr

# and the one that saves you when the executor dies before you can react
-XX:+HeapDumpOnOutOfMemoryError -XX:HeapDumpPath=/tmp/oom-%p.hprof
You mentioned Flight Recorder. Sell it to me. Why not just take a heap dump and a thread dump and be done?
Because a heap dump and a thread dump are both snapshots, and half the problems I chase are about timing.
JFR gives me a correlated timeline: allocation by call site, lock contention with durations, I/O with the file or socket that caused it, GC events, and thread states — all on the same clock. When the question is “what was this executor doing during the ninety seconds when the stage stalled”, that's a JFR question and nothing else answers it as well.
It's also low-overhead enough to leave running, which matters when the problem happens once a night.
   CHOOSING — the whole decision in four lines

   GC log       ->  memory behaviour over time
                    "is it churn, or is it retention?"

   Heap dump    ->  the objects occupying memory
                    "what, specifically, is being held?"

   Thread dump  ->  execution state, right now
                    "what is it waiting on?"

   JFR          ->  a correlated timeline of all of it
                    "what happened during that window?"

   Ask before you collect: what would this artefact
   tell me that I do not already know? If the answer
   is "I'd have to look", you are not investigating.
   You are shopping.
Executor dies. No OOM in the log. Nothing in the driver except “executor lost”. Heap looked fine right up to the end. Which instrument?
None of them, probably — and that's the point of asking the question.
If the heap was fine and there's no OutOfMemoryError, the JVM didn't fail. Something killed it from outside. That's the container being terminated for exceeding its memory limit, and the memory that exceeded it wasn't heap — it was off-heap: native allocations, direct byte buffers, memory-mapped files, a Python worker, or the JVM's own metaspace and thread stacks.
So I'd go to the container's kill record and the node's memory accounting, not to a heap dump. A heap dump would have shown me a perfectly healthy heap and cost me two days of believing I had no evidence.
Good. That's the one I actually care about.
“I'd take a heap dump and a thread dump and analyse them.”
Collecting artefacts is not investigating. Without a hypothesis, the analyser will show you ten thousand objects and you will pick the one that looks suspicious.
“I'd use a profiler.”
Which one, attached to what, during which window, answering which question? Escalation work happens on other people's clusters where “attach a profiler” is often not a thing you can do.
“Executor died, so increase the memory overhead.”
This is sometimes the correct fix — and it is still a guess until you have looked at what was consuming off-heap memory and why.
Rapid fire. Alex stops letting Jordan finish sentences.
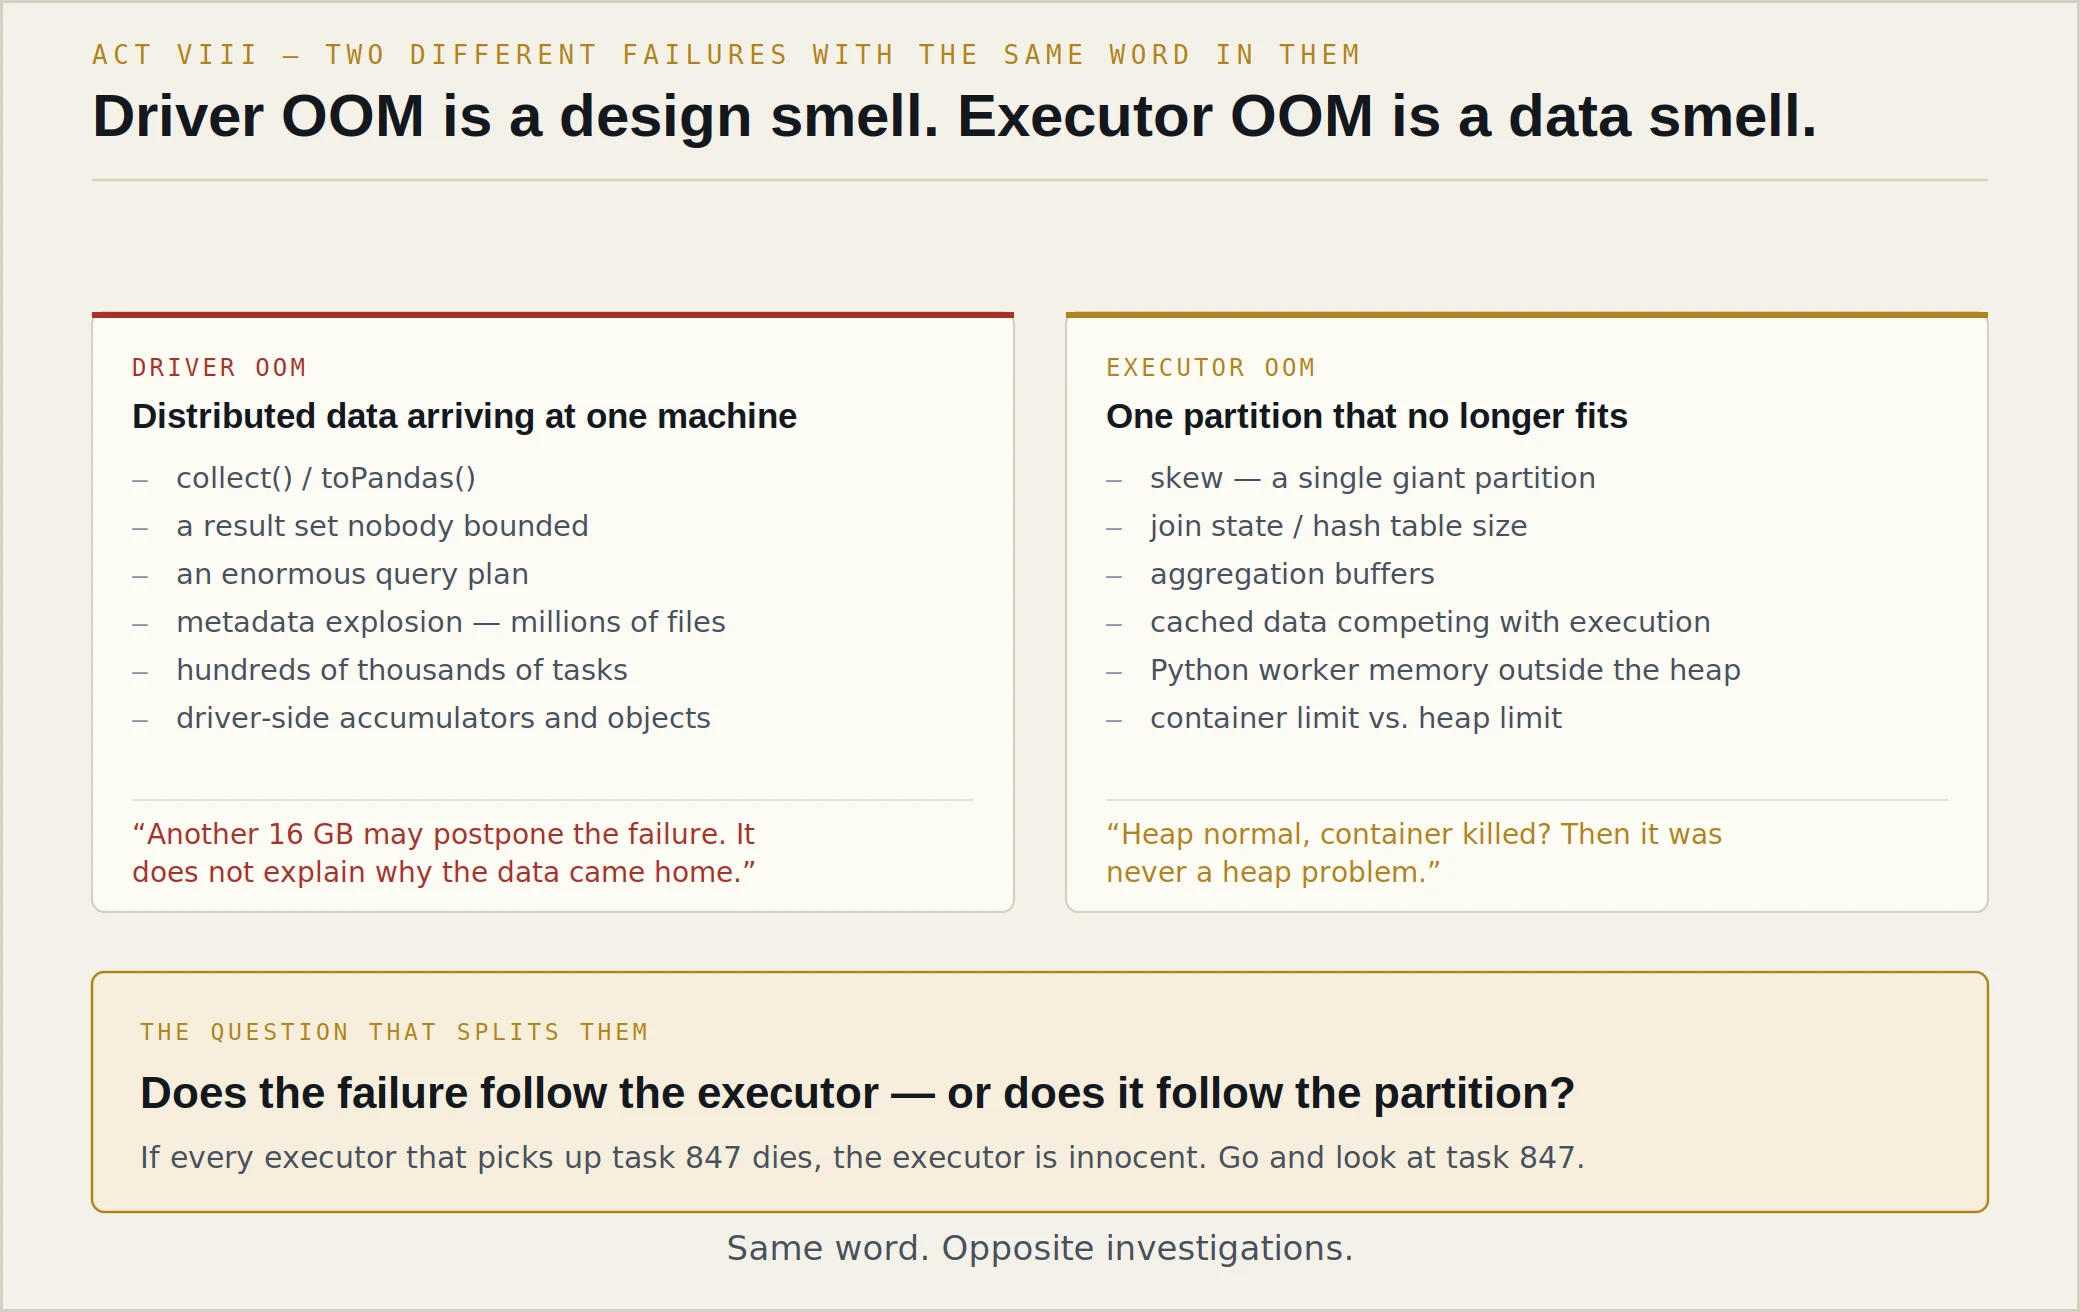
Driver OOM. Causes. Go.
collect(). toPandas(). A result set nobody bounded. An enormous query plan — I've seen a plan tree from a loop that built four hundred unions and the driver died compiling it. Metadata explosion: listing a table with two million files puts two million file entries in the driver's memory before a single row is read. Hundreds of thousands of tasks, because the scheduler's bookkeeping is per-task and it isn't free. Driver-side accumulators. Broadcast variables that turned out not to be small.
Fix?
Giving the driver another sixteen gigabytes may postpone the failure, but I still need to understand why distributed data is being concentrated onto one machine. That's a design question. The driver is the one component in the whole architecture that doesn't scale out, and every driver OOM is something violating that.
Executor OOM. Causes.
Skew, first and most often. Giant partitions from a bad repartition or a badly chosen partition column. Join state — the build side of a hash join sized by data rather than by configuration. Aggregation buffers, especially high-cardinality groupings. Cached data competing with execution memory. Python worker memory, which lives outside the heap and gets charged to the container. And oversized execution state generally — sorts, windows over huge partitions.
You get one question to tell them apart. What is it?
Does the failure follow the executor, or does it follow the partition?
Explain.
If executor 12 dies and its tasks get rescheduled onto executor 30 and executor 30 dies too — and then executor 44 dies with the same task — the executors are not the problem. Task 847 is the problem, and I should be looking at what data task 847 was handed.
Whereas if executor 12 keeps dying no matter which tasks it gets, and the others are fine, then it is the executor: a bad host, a noisy neighbour, a disk that's full, a different instance type that snuck into the pool.
One question, and it splits the entire investigation in half.
Last one on this. Customer's executor is killed by the container runtime. Exit code 137. Heap was at forty per cent. What's your first hypothesis?
Off-heap. The container limit covers everything the process touches — heap, plus metaspace, plus thread stacks, plus direct buffers, plus any native library, plus Python workers if there are any. The heap can be comfortable while the container is over its limit.
First things I'd check: is this a PySpark workload? Python workers are the most common answer and they're invisible in every JVM tool. Second, is there a lot of shuffle? Netty's direct buffers scale with concurrency. Third, how many threads — thread stacks are a megabyte each and a badly configured connection pool can quietly eat a gigabyte.
And I'd want to know whether the overhead fraction was ever sized for this workload or just inherited from a template written for a different one four years ago.
“Increase the driver memory.”
Buys one dataset size, teaches nothing, and hides the collect() that will eventually be called on a bigger table.
“Executor OOM means we need bigger instances.”
If the failure follows a single partition, a bigger instance just means the same partition kills a more expensive machine.
“It's an OOM, so it's a memory problem.”
Exit code 137 with a forty-per-cent heap is a memory problem in the same way that a locked door is a key problem. Which memory, owned by what, counted against which limit?
Not an algorithms puzzle. A question about where time goes, and then thirty lines written out loud.
After a break. Alex has coffee now, which is not a good sign for Jordan.
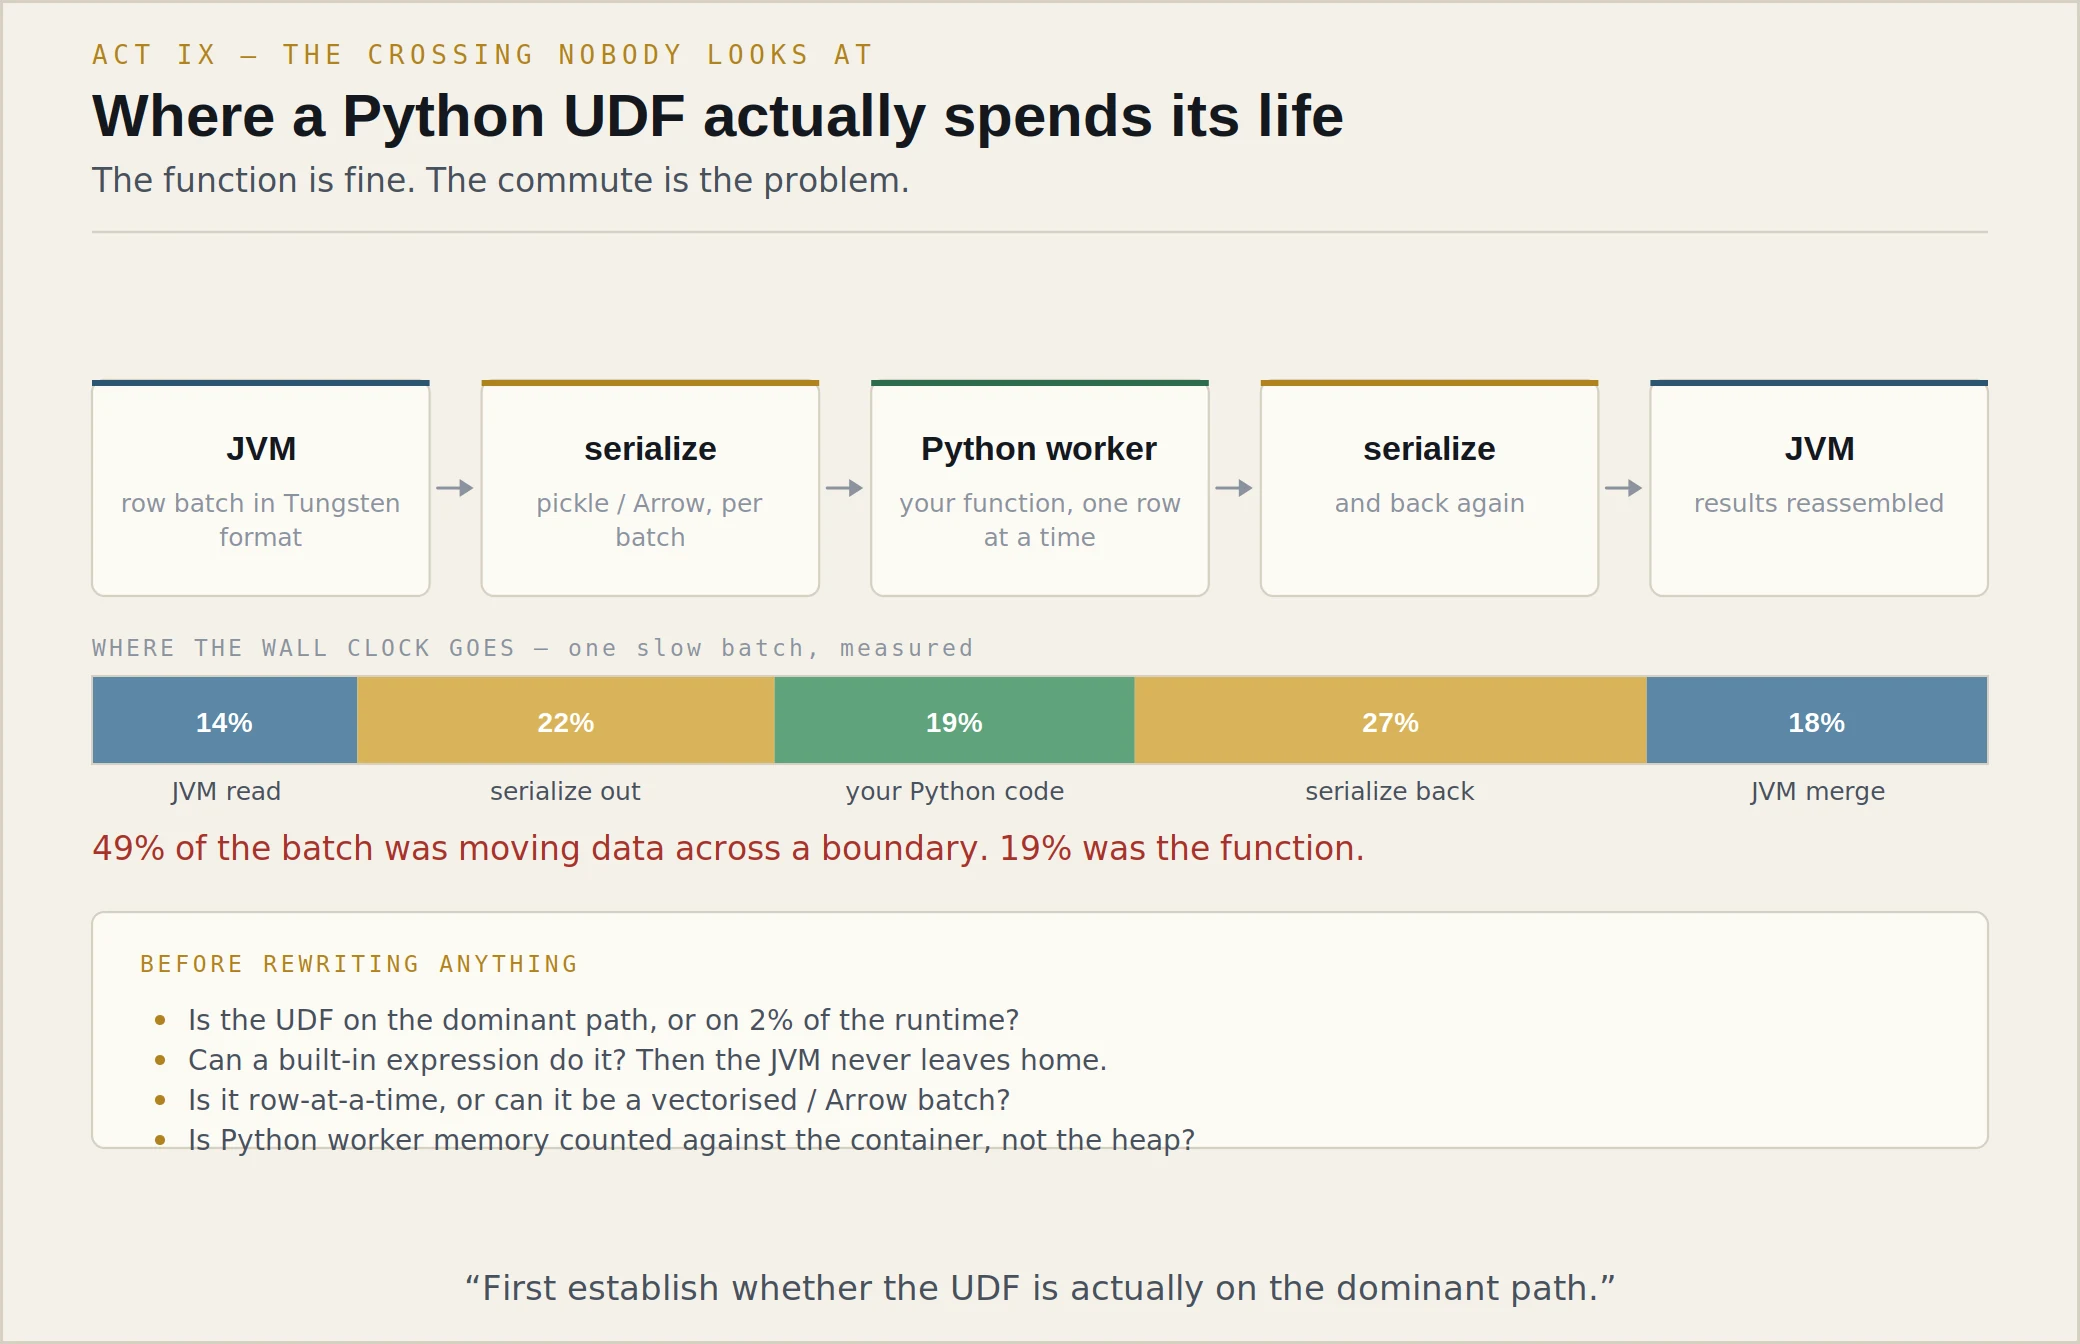
Why can Python UDFs become expensive?
Because the function isn't the expensive part. The commute is.
Spark's execution engine runs on the JVM, in a compact internal row format. A Python UDF can't touch that. So for every batch, rows are serialised out of the JVM, sent over a local socket to a separate Python process, deserialised into Python objects, your function runs one row at a time, the results are serialised back, and the JVM deserialises them again.
Four format conversions and two process boundaries, per batch, to run a function that's usually about four lines long.
There's a second cost people forget: it breaks whole-stage code generation. Spark can fuse a chain of built-in expressions into one generated Java method that runs over the rows with almost no overhead. A Python UDF is an opaque box in the middle of that chain, so the fusion stops on both sides of it.
And a third: the Python process has its own memory, outside the JVM heap, charged against the container. That's how you get an executor killed with a perfectly healthy heap.
So you'd rewrite every Python UDF you find.
No. First I'd establish whether the UDF is actually on the dominant path.
I've watched a team spend three weeks rewriting UDFs in Scala for a pipeline where the UDFs accounted for four per cent of the runtime and the other ninety-six was a shuffle they never looked at. They shipped it. The pipeline got about two per cent faster. Everyone was very tired.
So: which stage is slow, is the UDF in it, and what fraction of that stage's time is the Python boundary. If the answer is “most of it”, then yes — and the options in order of how much I like them are: replace it with built-in expressions so the JVM never leaves home; make it a vectorised, Arrow-based function so the crossing happens per batch instead of per row; or, if the logic genuinely can't be expressed either way, keep it and accept the cost knowingly.
How would you profile Python worker memory? Concretely — you can't attach a JVM tool to it.
Right, and that's exactly why it's the blind spot.
First I'd look at the platform's own accounting — most Spark distributions expose a Python memory limit and will fail the worker with a clear message rather than letting the container die, if it's configured. Getting that limit set is worth more than any profiling, because it converts a mysterious container kill into a legible error.
Then, from outside: resident set size of the python processes on the executor node over time. That's a shell command and a bit of patience, and it tells you whether the growth is per-batch or monotonic.
From inside, if I can reproduce it: a memory profiler in the worker, or — more often, because it's simpler — I look at what the function does per row. The usual culprits are embarrassingly mundane. Loading a model or a lookup table inside the function instead of once per partition. Accumulating results in a list. Pulling a whole partition into pandas because the API made it easy.
And the structural fix, most of the time, is mapPartitions-shaped thinking: do the expensive setup once per partition, not once per row.
Small exercise. Not a puzzle — I don't care about clever.
You've got an events table. Three billion rows a day. Each row has an event_id, a customer_id, an updated_at timestamp, and a payload. Upstream sends duplicates: the same event_id can arrive several times, and later arrivals are corrections. I want one row per event_id — the latest one.
Write it. Talk while you do.
Okay. The obvious first draft is a window function, and I'll write that, but let me say what I'm worried about before I write it so you can see me be wrong in advance.
Worry one: ties. If the same event_id arrives twice with the same updated_at, “the latest” isn't defined and I'll get non-deterministic output. That's the kind of bug that shows up as “the report changes when we re-run it” six months later.
Worry two: nulls in updated_at. Ordering with nulls is a decision, not a default I should accept silently.
Worry three: this is a shuffle on event_id, which is high cardinality, so it should distribute well — but if the upstream duplicates cluster, some keys could be hot.
Let me write the straightforward version.
WITH ranked AS (
  SELECT *,
         row_number() OVER (
           PARTITION BY event_id
           ORDER BY updated_at DESC, ingest_seq DESC   -- tie-break
         ) AS rn
  FROM   raw_events
  WHERE  event_date = '2026-09-02'
)
SELECT * EXCEPT (rn)
FROM   ranked
WHERE  rn = 1;
I've added ingest_seq as a tie-break, assuming there's a monotonic arrival ordering — and if there isn't, that's a question for the customer, not something I invent. Without it, this query is a coin flip on duplicate timestamps and it will silently disagree with itself between runs.
What's wrong with it?
At three billion rows, the row_number is doing more work than the problem requires.
A window function has to shuffle by event_id, then sort within each partition, then assign numbers, then discard everything except rank one. I'm paying for a full ordering of every duplicate group in order to answer a question that only needs a maximum.
If ninety-eight per cent of my event_ids have exactly one row — which is typical for a deduplication job — I'm sorting three billion rows to fix sixty million of them.
So what would you write instead?
An aggregation with a struct, which turns the ordering into a max.
SELECT event_id,
       latest.updated_at   AS updated_at,
       latest.customer_id  AS customer_id,
       latest.payload      AS payload
FROM (
  SELECT event_id,
         max(struct(updated_at, ingest_seq, customer_id, payload)) AS latest
  FROM   raw_events
  WHERE  event_date = '2026-09-02'
  GROUP BY event_id
) t;
Struct comparison is lexicographic by field order, so the first two fields decide the winner and the rest come along for the ride. It's a partial aggregate — each partition can reduce locally before the shuffle, so the volume crossing the network is proportional to the number of distinct event_ids per partition rather than to the number of rows.
Two honest caveats, because I don't want to oversell it. If the payload is large, dragging it through the struct isn't free, and it may be better to aggregate to the key plus timestamp and then join back. And this reads worse than the window version — the next engineer will have to think about why it's written this way, so it needs a comment saying so.
Now suppose I tell you the job still takes four hours and the stage that's slow is the aggregate.
Then I'd stop optimising the query and go back to looking, because I've now made two changes based on reasoning and zero based on measurement.
My guess would be that the bottleneck was never the dedup at all — it's the scan. Three billion rows a day, if that's landing as a large number of small files, the read is the cost and both of my clever queries are rearranging deck furniture. But that's a guess, and the metrics would take four minutes to check.
(writing something down) That's a good instinct. Hold that thought, because that's the next question.
Writes the window function silently, then says “done”.
The code may be perfect. The interviewer has learned nothing about how you'd behave on a problem where the answer isn't obvious — which is every problem in this role.
“I'd use dropDuplicates.”
Which row does it keep? On a distributed engine, an unordered de-duplication gives you a row, not the latest row, and the difference shows up as a data-quality incident three months later.
“I'd rewrite it in Scala for performance.”
The language was never the cost. This is the same reflex as rewriting the four-per-cent UDF.
The customer describes a query problem. The evidence describes a writing problem.
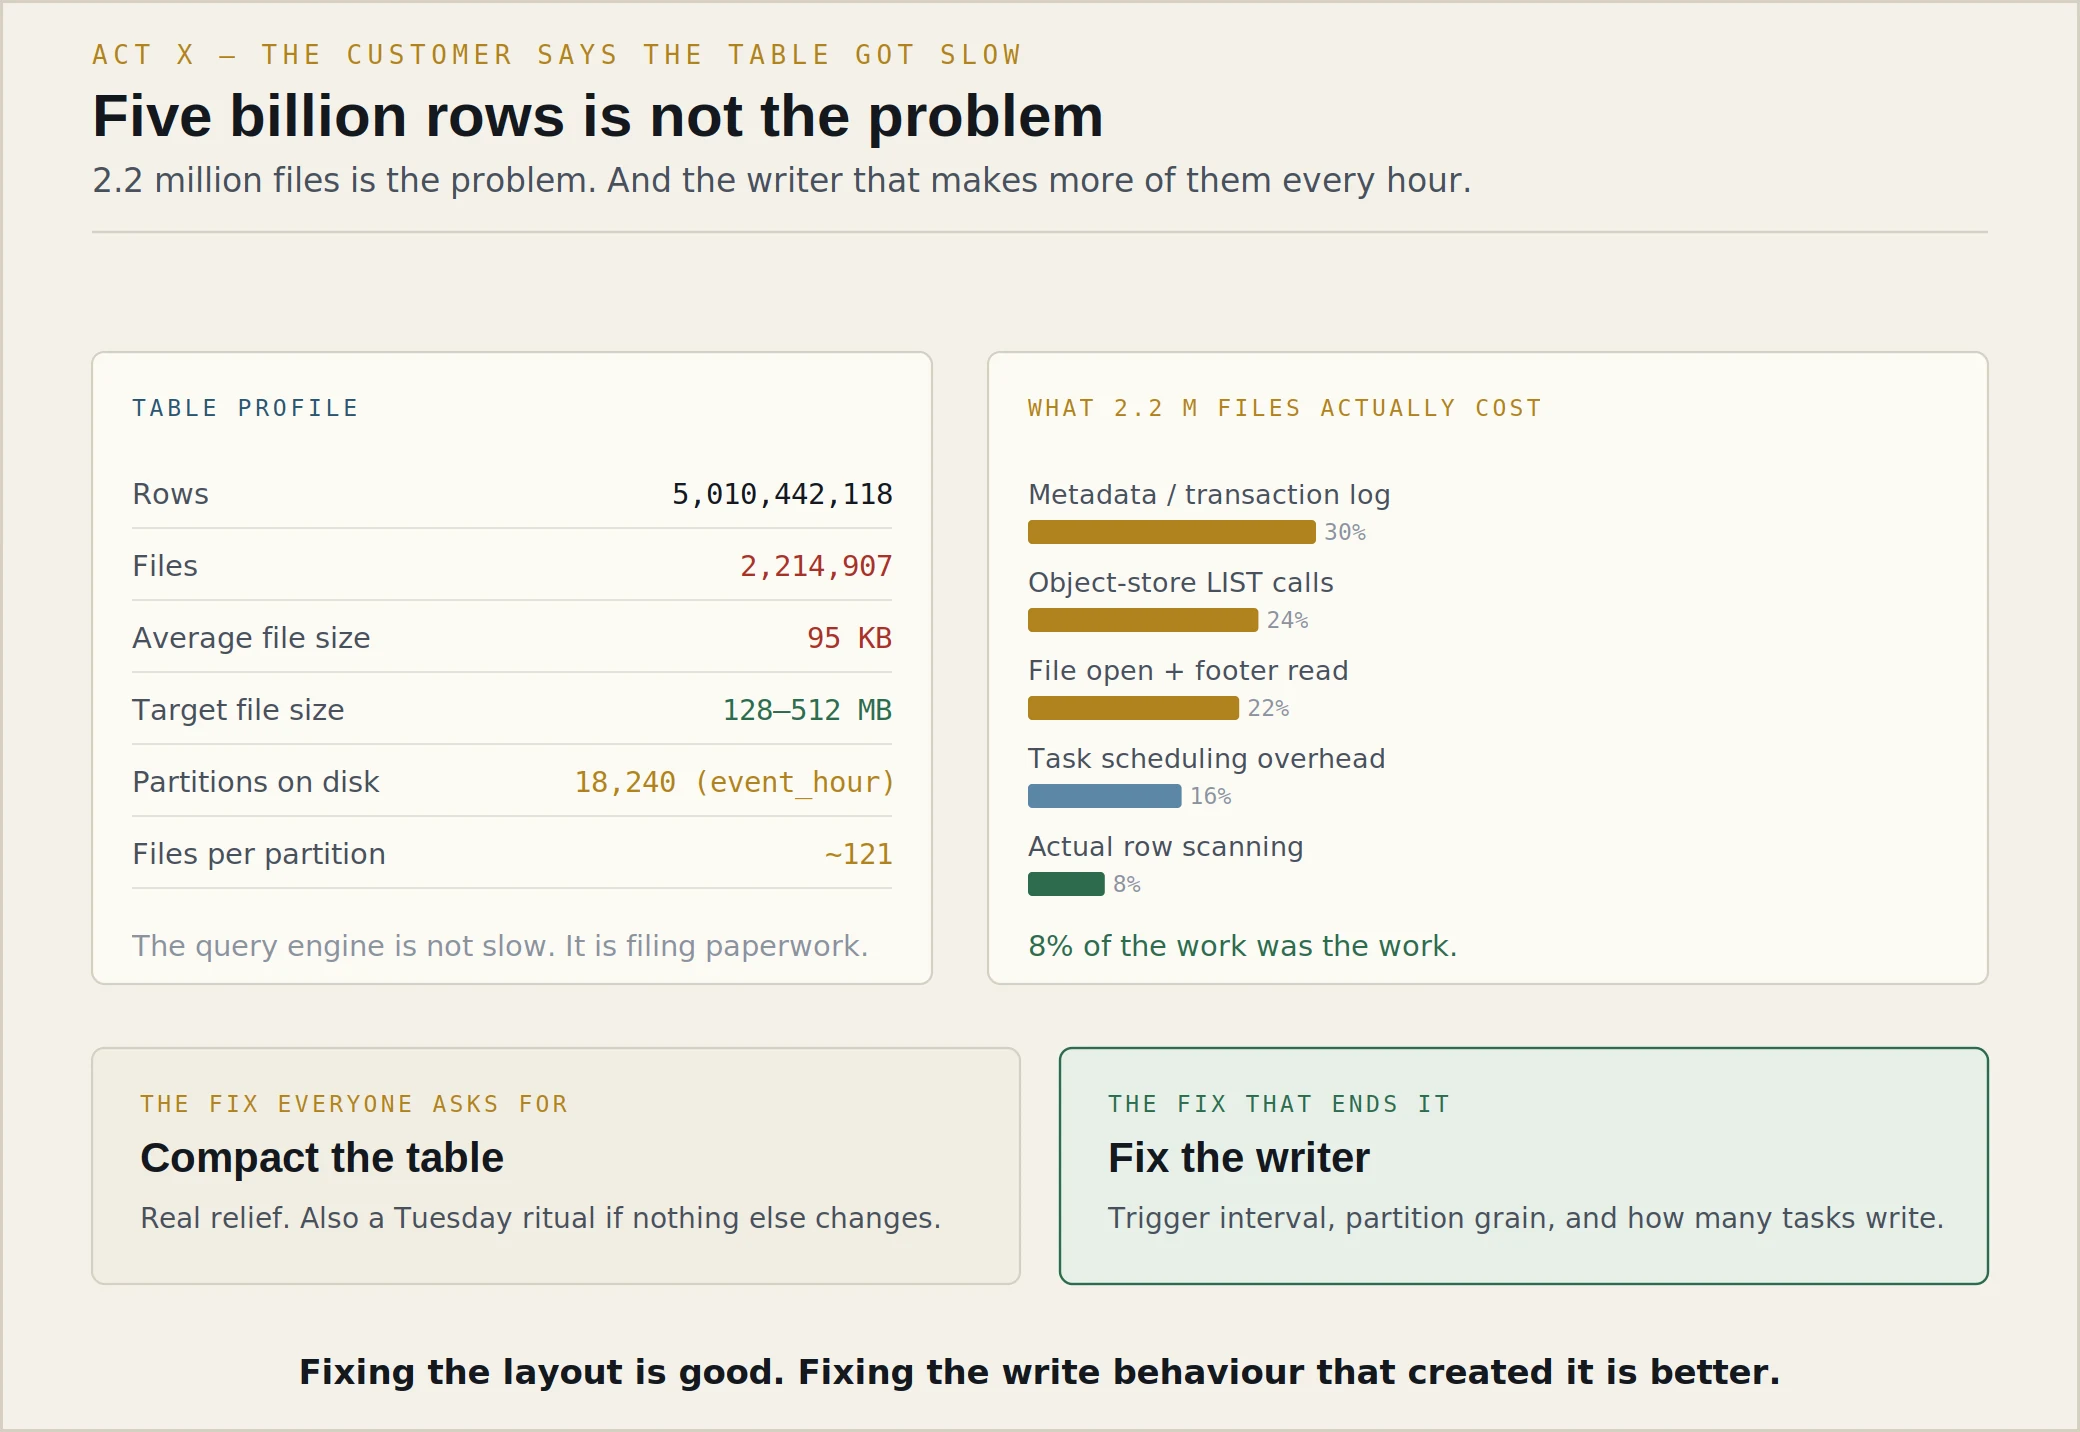
Customer has a table with five billion rows. Queries against it are getting slower every week. Same queries, same cluster. They want to know what's wrong with our query engine.
How many files?
(a small pause, which is as close as Alex gets to approval) Two point two million. Average size ninety-five kilobytes.
Then the query engine is fine and the table is the problem.
Ninety-five kilobytes is a rounding error. For columnar formats you generally want files in the hundreds of megabytes — big enough that the metadata and the open cost are amortised over real work, small enough to parallelise and to skip. Ninety-five kilobytes means every file's footer is a significant fraction of the file, and every file costs a listing entry, a request, an open, a footer read, and a task.
Two point two million of anything is a lot. Two point two million round trips to object storage is an afternoon.
Break down where the time actually goes.
Four places, and none of them are “reading rows”.
Metadata: the transaction log has to be replayed to know which files are current. With millions of files and a long history of small commits, that's real work, and it happens on the driver.
Listing: enumerating the files, which on object storage is a paginated API call, not a directory read.
Open and footer: every columnar file has a footer with schema and statistics. You read it before you read any data. Two million footers is two million small random reads.
Scheduling: one task per file, more or less. Two million tasks would kill the driver, so the reader packs them — but packing costs planning time, and the tasks are still short and numerous, which means scheduling overhead dominates useful work.
Actual row scanning is the smallest slice. That's the part everyone assumes is the problem.
Fix it.
Compaction, tonight. Rewrite the small files into large ones. That's a real fix and it'll give them their query performance back within hours.
But if that's all we do, we're back here in six weeks. Fixing the file layout is good. Fixing the write behaviour that created the layout is better.
So what created it?
I'd ask three questions and I'd bet the answer is in them.
One: how often does the writer commit? A streaming job with a ten-second trigger writes eight thousand six hundred and forty commits a day. If each commit produces one file per writing task and there are twenty tasks, that's a hundred and seventy thousand files a day from a single pipeline.
Two: what's the partition grain? Two point two million files over eighteen thousand partition directories means the partitioning is too fine. Partitioning by hour when you have a small hourly volume produces directories with three files in them, and the partition column stops being a pruning aid and starts being a file multiplier.
Three: how many tasks are writing? Two hundred shuffle partitions writing into a hundred date partitions is twenty thousand files per commit, arithmetic that nobody intends and everybody produces.
They've also got a MERGE that runs hourly and they say it keeps failing with a concurrency error.
That's the same story from the other end, and it's a good sign my file-count theory is right.
Table formats like this use optimistic concurrency. A writer reads the current version, does its work, and then tries to commit — and at commit time it checks whether anyone else has modified the files it depended on. If they have, it fails and retries.
Two things make that fail more often. First, long transactions: the slower your MERGE, the wider the window for someone else to commit underneath you. And a MERGE against two million files is very slow, because it has to find the files containing the matching rows before it can rewrite them. Second, wide file touches: if your MERGE has to rewrite files scattered across the whole table because the data isn't clustered by the merge key, it conflicts with everybody.
So the compaction fixes the query performance and the merge conflicts, which is a nice thing to be able to tell a customer. And the durable fix is to cluster the table on the key the MERGE actually uses, so each merge touches a narrow set of files and finishes before anyone can conflict with it.
Anything you'd warn them about before they run a big compaction?
Yes, three things, and I'd put them in writing.
Compaction rewrites data, so it produces a new version of the table and it is not free — it costs compute and it costs a spike in storage until old files are cleaned up. Any concurrent writer during the compaction is a conflict waiting to happen, so it wants a quiet window. And their history retention policy determines how long they carry both copies, which is a cost conversation their finance team will have with them if we don't have it first.
Also: if they have any readers doing time travel or streaming from this table, a large rewrite changes what those readers see. That's the kind of thing you discover afterwards if you don't ask.
“Five billion rows is a lot — they need a bigger cluster.”
Five billion rows is unremarkable. The size of the table was never the issue and a bigger cluster will schedule the same two million tiny tasks slightly faster.
“Run OPTIMIZE.”
Correct, incomplete, and the same answer they'll need again in six weeks. It also skips every caveat that makes running it safe.
“Partition the table more finely so queries can prune better.”
Exactly backwards. Over-partitioning is one of the two mechanisms that created the small files in the first place.
The backlog is arithmetic. The pressure to do something reckless about it is not.
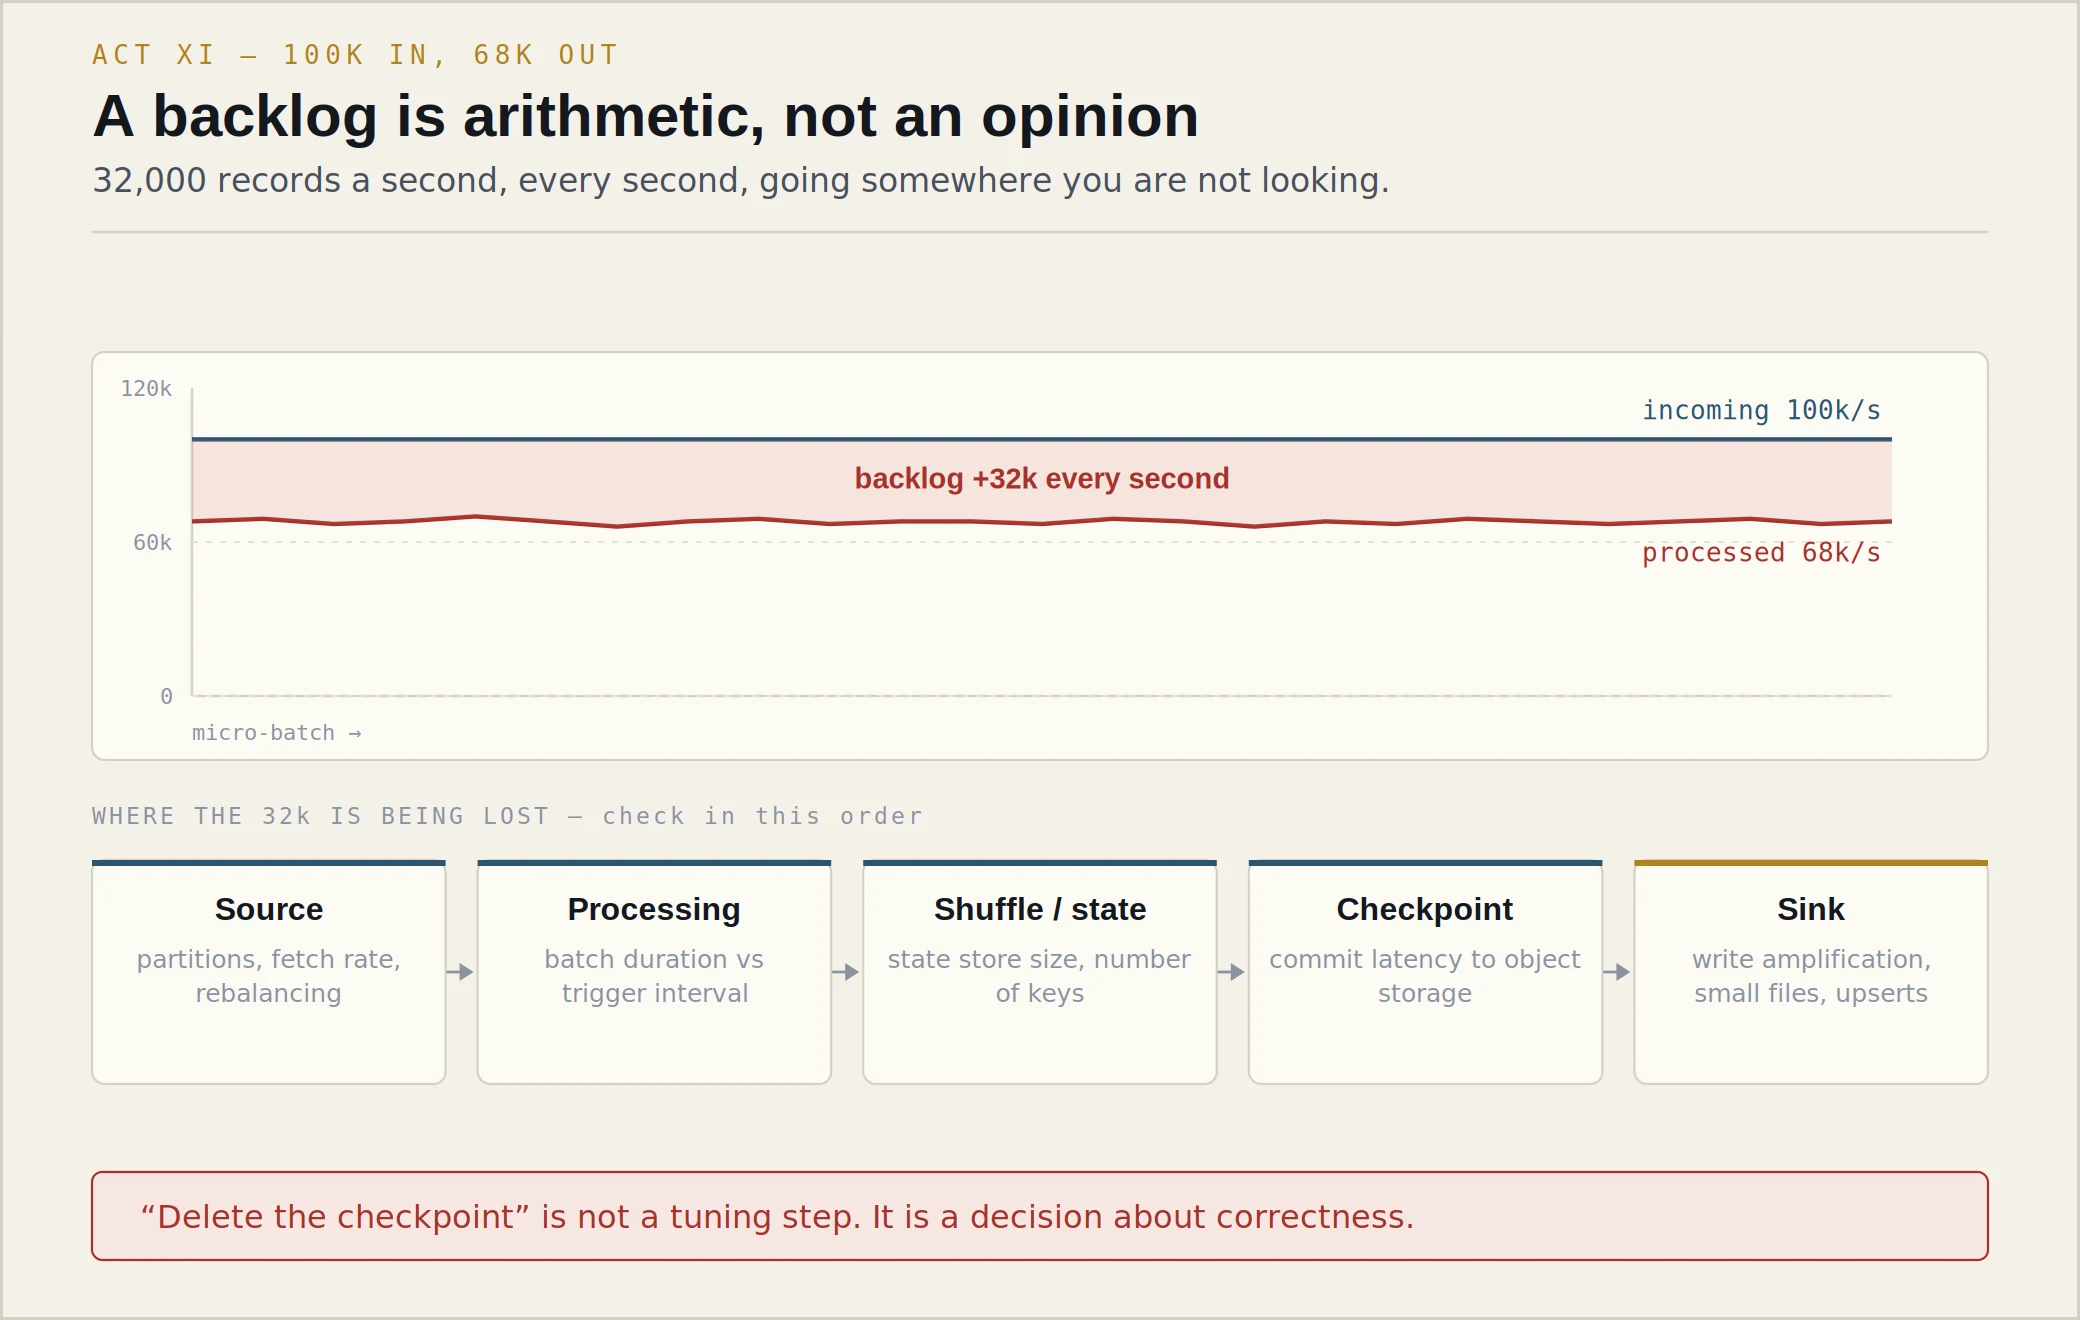
Streaming pipeline. Incoming rate a hundred thousand records a second. Processing rate sixty-eight thousand. The backlog has been growing for eleven hours.
Do we add workers?
Maybe. But adding workers only helps if the thing that can't keep up is parallelisable, and I don't know that yet.
First I need to find which part of the pipeline can't sustain the incoming rate. Because “processing rate is sixty-eight thousand” is an output measurement — it's the number that falls out of everything else. It doesn't tell me where the ceiling is.
   Kafka / source
         |
         v
   Spark processing        map, filter, parse, enrich
         |
         v
   Shuffle / state         aggregations, joins,
         |                 dedup state, session windows
         v
   Checkpoint              offsets + state committed
         |                 to object storage, every batch
         v
   Sink                    the write, and its own
                           concurrency and conflicts

   Any ONE of these can be the ceiling.
   Adding executors helps with exactly two of them.
What I'd want off the streaming metrics, in order:
Batch duration against trigger interval. If batches are taking twelve seconds on a ten-second trigger, the backlog is inevitable and the question becomes “which phase of the batch”.
The breakdown within the batch — how much is planning, how much is the actual query, how much is the commit. That last one catches people out: if the checkpoint commit is taking four seconds of a twelve-second batch, adding executors will do absolutely nothing, because the commit is a serialised operation against object storage.
State store metrics. Number of keys, size on disk, and — the important one — how much time is spent in state operations per batch. Unbounded state growth is the classic streaming failure: it works beautifully for three weeks and then degrades every day.
Watermark and late data. If the watermark isn't advancing, state is never evicted, and you have a job that is slowly turning into a database.
Source parallelism. If the topic has twenty-four partitions, twenty-five executors buys nothing. That's the case where “add workers” is simply not available to you.
And sink latency, which is where I'd expect this one to be, honestly. A hundred thousand records a second into a table with any kind of upsert semantics is a write-amplification problem long before it's a compute problem.
Batch duration is fourteen seconds on a ten-second trigger. Query execution is four seconds of that. State operations are one second. The commit is eight and a half.
Then adding workers is precisely the wrong move and I'd say so plainly, because it costs money and buys nothing.
Eight and a half seconds of commit means the checkpoint write is the ceiling. That's usually one of three things: the state is large and being written in full rather than incrementally; the checkpoint location is on storage with poor small-write performance or in a different region from the compute; or the number of state store partitions is high enough that the commit is thousands of small writes rather than dozens of large ones.
The lever people forget is the trigger interval. If the batch takes fourteen seconds and eight of it is fixed cost, then running every thirty seconds instead of every ten roughly triples throughput without adding a single machine — because you're paying the fixed cost a third as often. You buy that with latency, and whether that trade is acceptable is a product question I'd take to the customer rather than decide for them.
Alex sits back and changes register. When Alex speaks again, the voice is different — faster, clipped, and annoyed.
Right, I've been on this call for forty minutes and we're talking about trigger intervals. My board deck needs these numbers at eight tomorrow morning and the backlog is nine hours deep. My lead engineer says if we delete the checkpoint directory and restart from latest, we skip the backlog and we're current in ten minutes.
Give me one reason not to do that.
(no pause) Because it would work, and that's the problem.
That's not a reason.
It is, and let me be quick about it because you're right that we've been slow.
The checkpoint holds two things: which offsets you've already consumed, and the state your aggregations have accumulated. Deleting it and starting from latest means the nine hours in your backlog are never processed. Not delayed — never. Those records exist in the source, your table will never contain them, and your eight o'clock deck will be built on numbers that are missing nine hours of activity without saying so anywhere.
And it's worse than a gap, because if any of your aggregations are stateful — running totals, sessions, deduplication — the state resets too. Your dedup window is empty, so records you'd already emitted can be emitted again if they reappear. You could get a gap and a double-count in the same table.
The deck will look complete. That's what makes it dangerous.
So what do I tell my board?
Here's what I'd do in the next thirty minutes, and you can decide.
One: raise the trigger interval to thirty seconds now. That's one setting, it's reversible, and based on the numbers on my screen it should roughly triple throughput. If it does, you're draining the backlog rather than growing it, and we can compute when you'll be current.
Two: in parallel, I'd start a separate one-off backfill job reading the same source over the backlog window, writing to a staging table. That's a batch job, it's parallel, and it doesn't care about your trigger interval.
Three: if you decide the deck matters more than the completeness — which is a legitimate business call and not mine to make — then we can start from latest and keep the old checkpoint, so the backlog is recoverable afterwards instead of gone. Move the directory. Don't delete it. That single word is the difference between a decision and an accident.
And whatever we choose, I'd want a line in your deck saying what window the numbers cover. Not because of process. Because someone will act on them.
Alex drops the character.
“Move the directory. Don't delete it.” That's the answer. Most people either cave or lecture.
“Yes, add more executors.”
Answers the question that was asked instead of the question that matters. Eight seconds of commit does not parallelise.
“Delete the checkpoint — it'll catch up.”
Silent data loss, presented as a fix, on a table someone is about to make decisions from.
“That would violate exactly-once semantics.”
Correct, and useless to a VP with a board meeting. Say what happens to their numbers, in their language, in one sentence — then explain the mechanism if they want it.
The most common sentence in platform support, and the one that most often turns out to be true — for the wrong reason.
Customer upgraded from runtime 12.4 to 13.0 on Saturday. Monday, a job that took forty minutes now fails after three hours with an executor out-of-memory error. They want us to roll them back and they want to know what we broke.
The rollback is a business decision and I'd probably support it — get them working, argue later. But it isn't the investigation, and I'd be careful not to let it become the conclusion.
Because “it worked before the upgrade” is a correlation, and upgrades change dozens of things at once. Some of them are ours. Some of them are theirs, because people upgrade during change windows when they also do other work. And sometimes the upgrade is genuinely innocent and the data changed on the same weekend, which is the most annoying possible outcome and happens more than anyone would like.
So what do you build?
A controlled experiment, and I build it before I have any theory at all, because I want the theory to come from the experiment rather than the other way round.
Same workload — the exact application, not a simplified version. Same data — a fixed snapshot, ideally a specific date partition, so the input can't drift under me. Same configuration, and I mean the effective configuration, not the config file. Same cluster shape and instance types. Same storage location.
One variable: the runtime. 12.4 and 13.0.
If 12.4 passes and 13.0 fails on that setup, I have a reproduction and the conversation stops being an argument. If they both fail, the upgrade is innocent and something else changed on Saturday — and I've saved everybody three days of chasing a release note.
Say it reproduces. 12.4 passes, 13.0 fails, every time. Now what?
Now I narrow, and each step should throw away half the suspects.
Physical plans first, diffed. This is the highest-yield step by a distance, because most runtime regressions that manifest as memory or performance problems show up as a different plan — a join strategy changed, an aggregate implementation changed, a pushdown that used to happen and doesn't.
Then the effective configuration, diffed. Not their config file — the actual runtime configuration on both versions, because platform defaults change between releases and that's frequently the whole story. A default that moved from 10 MB to 100 MB, or an optimisation that went from off to on.
Then the logs at the first point of divergence. Not the failure — the failure is three hours downstream of the cause. The first place where the two runs stop looking the same.
Then, if it's still not obvious, I'm reading source. Which component changed, what does the new code path do differently, and can I find the specific behaviour rather than the specific commit.
And what I hand over is a reproduction that runs in five minutes, not three hours. That's my job, not Engineering's.
Here's the plan diff.
  - BroadcastHashJoin [customer_id], [customer_id], Inner, BuildRight
  + SortMergeJoin      [customer_id], [customer_id], Inner

  - Statistics(sizeInBytes=39.4 MiB)
  + Statistics(sizeInBytes=8.0 EiB)

  # and, buried in the effective config diff:
  - spark.sql.statistics.fallBackToHdfs = true
  + spark.sql.statistics.fallBackToHdfs = false
Well, there it is, and it's a much better story than “we broke it”.
Their table has no statistics — it never did. On 12.4 the platform was falling back to file sizes on storage to estimate the table size, which happened to be small, which allowed the broadcast. That fallback default flipped in 13.0. Now the estimate is the unknown-size sentinel, no broadcast, sort merge join, eight terabytes shuffled, executors out of memory.
So: the upgrade is the trigger, and the underlying condition is a table that has never had statistics. Both of those things are true and I'd say both.
Alex leans forward, and the tone changes again — flatter, more clipped. This time it isn't the customer.
I've read your ticket. That default change was intentional and it went through review. The old behaviour was a hack that gave wrong estimates on partitioned tables and caused three incidents last year. The customer's table has no statistics. That's their problem. Tell them to run ANALYZE.
I'm closing this as working-as-intended.
I agree with all of that, actually, and I don't want the default reverted.
Then what are we discussing?
The failure mode, not the decision.
The change is right. The way it fails is bad. A customer with no statistics goes from a working job to a three-hour out-of-memory error, with nothing anywhere that says “this plan changed because your table has no statistics”. They can't find that. I found it, and it took me a day, and I do this for a living.
So I'm not asking you to revert. I'm asking for two things. One: when the optimiser falls back to the unknown-size sentinel on a table that a query is joining, emit that. A warning in the plan, an event in the log, something. That's a small change and it would have made this a fifteen-minute investigation for me and a self-service fix for them.
Two: this is in the release notes as a configuration default change in a list of forty. It's actually a behaviour change that can alter join strategy on any table without statistics. That's an upgrade-impact note, and I'd like to write it if you don't want to.
(pause) …The warning is reasonable. Send me the reproduction.
Alex drops the character again, and is almost smiling.
You gave away the revert immediately.
Because I didn't want it. If I'd fought for the revert I'd have lost, correctly, and I'd have spent all my credibility doing it. What I actually wanted was the diagnostic and the release note, and those are cheap for them and enormous for us.
Knowing which fight you're actually in is most of the job.
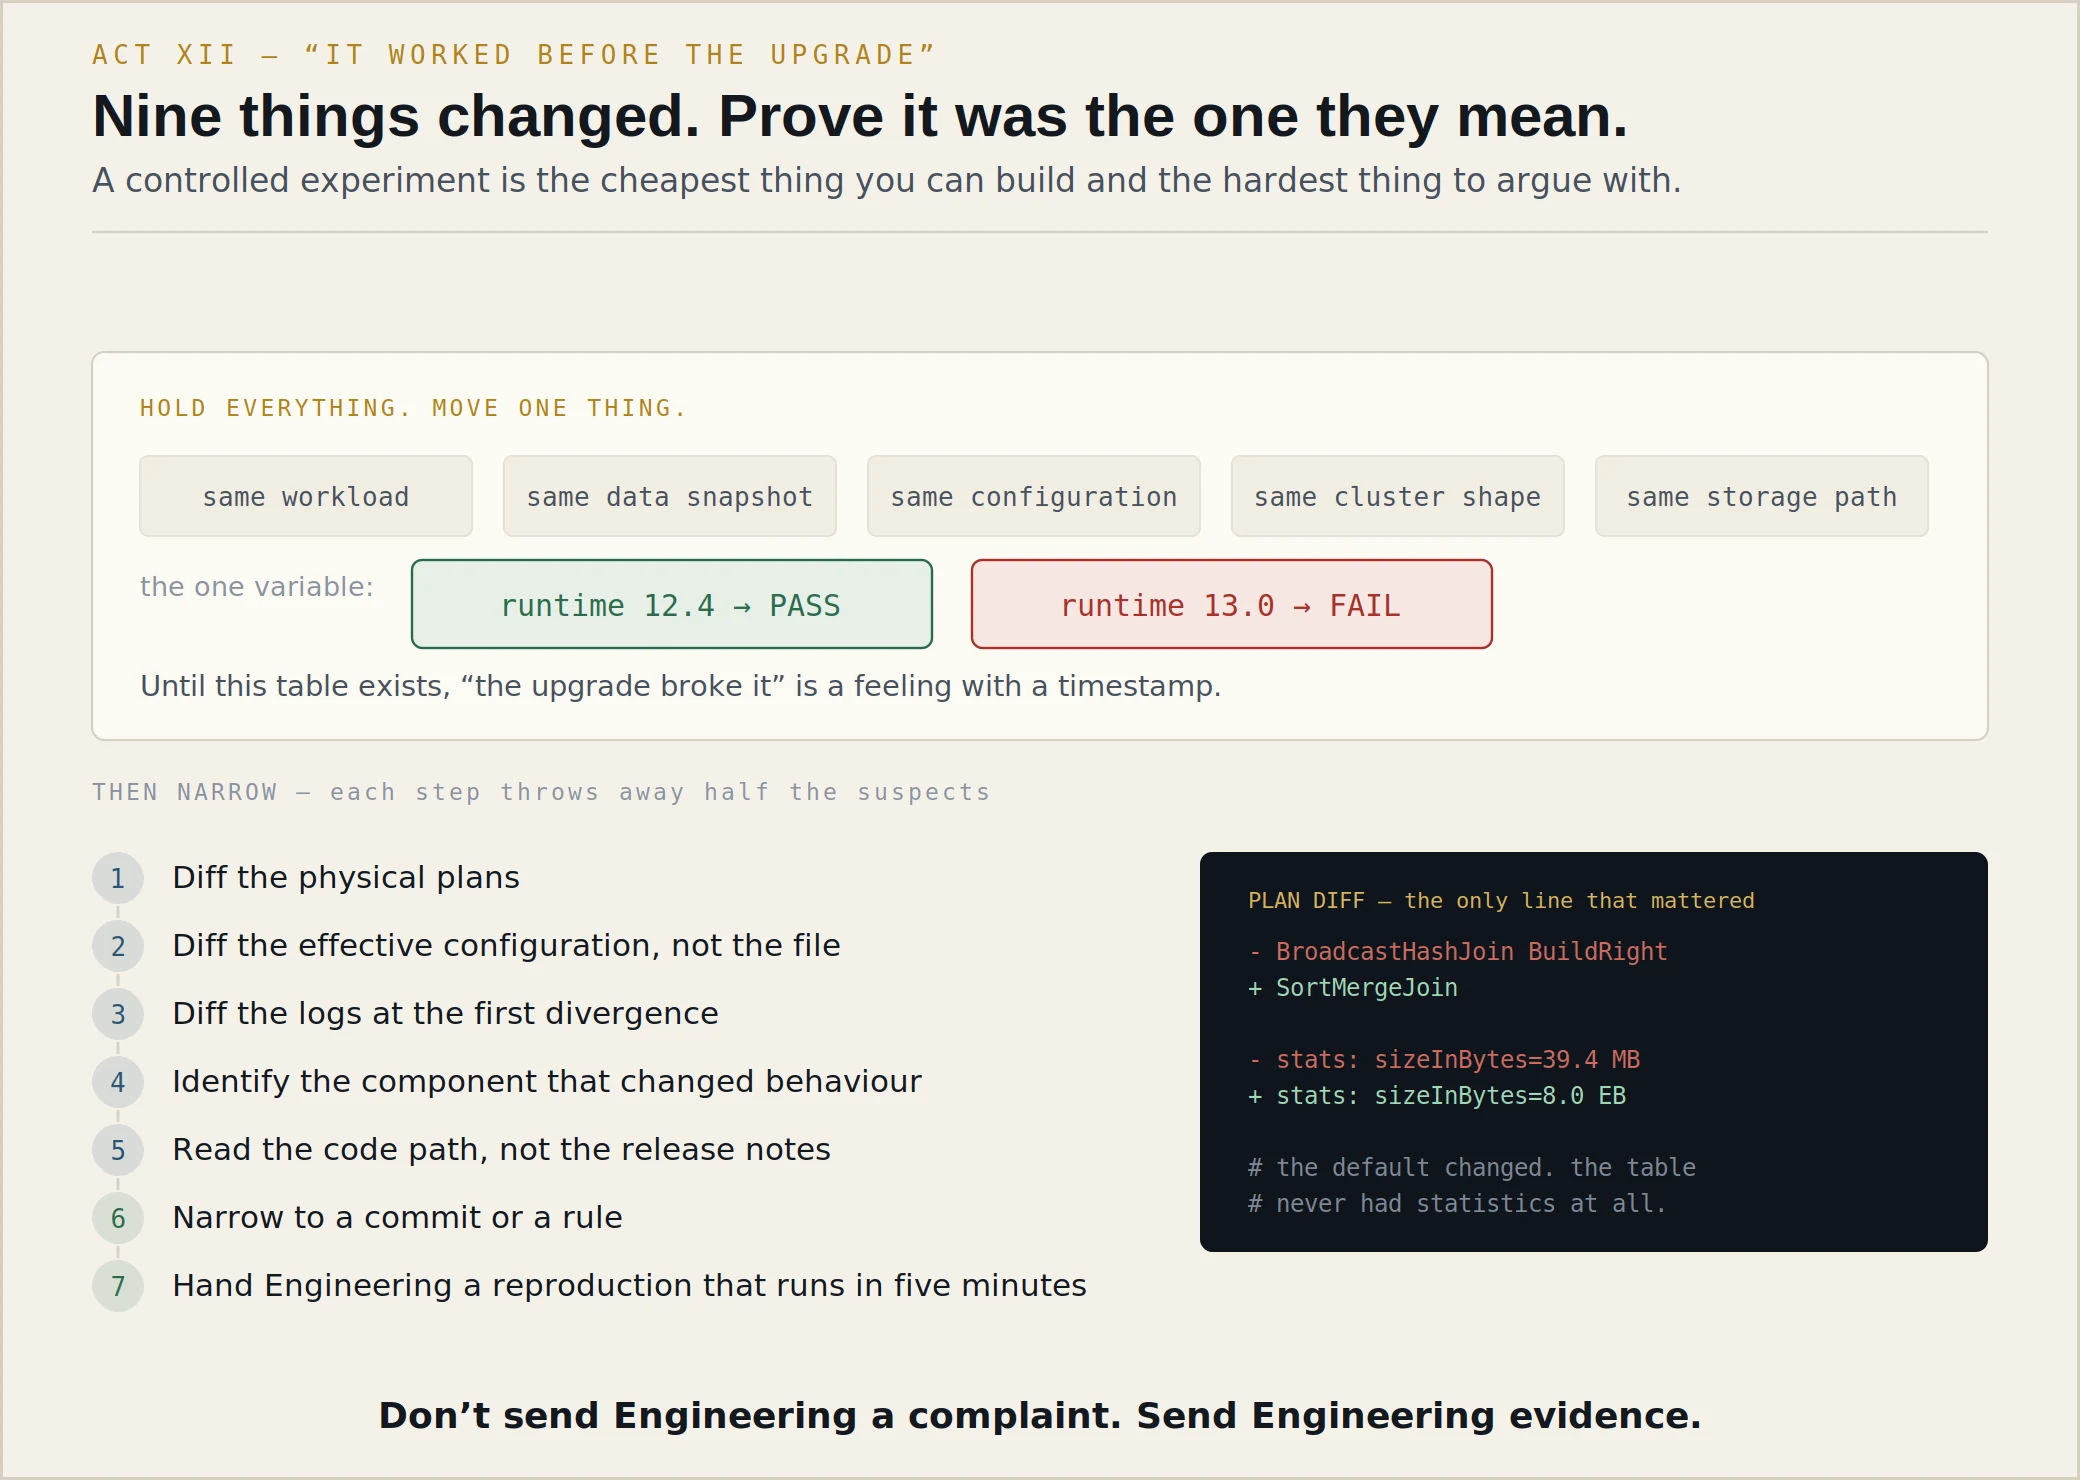
“The upgrade broke it. We should roll back and file a P1 bug.”
Sends Engineering a complaint. It will be triaged, questioned, and returned in four days with “cannot reproduce”.
“Spark is probably buggy in 13.0.”
A hypothesis with no experiment attached, aimed at the component that is hardest to change and least likely to be at fault.
“Tell the customer to run ANALYZE and close the ticket.”
Technically sufficient, professionally hollow. The next forty customers with unanalysed tables will hit the same wall, and none of them will find it in a day.
Four hours in, Alex stops asking about systems. The last technical answer told them everything they needed; what's left is who Jordan will be at 3 a.m.
Tell me about a mistake. Not a weakness dressed up as a strength — I've heard “I care too much” enough times for one career.
A financial services customer had intermittent job failures — maybe one run in fifteen, always with a shuffle fetch failure. I had a strong prior, because I'd seen the same signature twice before, and both times it had been network: a saturated cross-zone path.
So I went looking for network evidence. And I found some — there were retransmits, there was elevated latency on some paths, and I built a fairly convincing case. We got their infrastructure team involved. They rearchitected placement so that executors were zone-local. It took eleven days of somebody's time.
The failure rate went from one in fifteen to one in seventeen.
Ouch.
Ouch is right. And the reason it took eleven days is entirely mine: I went looking for evidence that supported my hypothesis instead of evidence that would kill it.
What was actually happening was that executors were occasionally being lost during a scale-down — the autoscaler was removing executors that still held shuffle output, and the fetch failure was a downstream consequence of a node that had gone away. The network noise was real and irrelevant. It was there on the successful runs too. I never checked that, which is the whole error in one sentence.
What changed after that?
Two things, one small and one that I think is the most useful thing I know.
The small one: I now always look at a healthy run alongside the failing one. Every signal I plan to blame has to be absent, or meaningfully different, in the run that worked. The network retransmits would have failed that test in ninety seconds.
The bigger one is how I hold a hypothesis. A hypothesis isn't something I defend. It's something I try to disprove. And practically, that means when I state one, I also state what would falsify it — out loud, to whoever's on the call — before I go looking. It's harder to quietly move the goalposts when you've written them down in front of six people.
Did you tell the customer you'd been wrong?
Yes, and it was a genuinely bad twenty minutes. But their infrastructure team had spent eleven days on my theory and they were entitled to know that the theory was mine and it was wrong. The alternative — quietly letting the real fix land and taking credit for the resolution — was available and I've watched people take it. You only get to do that once before nobody believes your next diagnosis either.
“I sometimes take on too much and burn myself out.”
A weakness chosen for how it sounds. It ends the conversation, which is presumably the point, and tells the interviewer you'd rather manage impressions than examine your own work.
“I once pushed to production without testing, but I learned to always test.”
The lesson is a platitude. The interesting mistakes in this discipline are reasoning errors, not process errors.
You'd have five or six engineers looking to you. How do you mentor?
Badly, at first, and then I learned to shut up.
The instinct when someone brings you a broken job is to look at it, see the answer, and give them the answer. It feels generous. It's fast, the customer is unblocked, and everybody says thank you. And it teaches nothing, because next month they bring you an almost-identical problem.
So now, when someone comes to me with “I think we need to increase the executor memory”, I don't say yes or no. I ask: what evidence tells us memory is the bottleneck?
Sometimes they have an answer and it's a good one, in which case I've learned something and they've had thirty seconds of confirmation. More often they pause and say “…the GC time is high”, and then we're in a useful conversation, because now I can ask what the GC time was on the run that worked.
That's slower.
Much slower, the first four times. Then it's much faster forever.
And I do have a rule about it: I don't do Socratic method during a Sev-1. If the customer is down, I give the answer, and we do the teaching in the postmortem when nobody is losing money. Using a live incident as a teaching moment is a form of self-indulgence.
What do you do when someone's diagnosis is wrong and they're senior enough to be confident about it?
I ask for the falsifying test rather than arguing with the conclusion. “What would we see if that were not true?” It's the same question I use on myself, it's not a status move, and half the time they find their own error while answering it — which is a much better outcome than me being right at them.
And when I'm the one who's wrong, which happens, it costs me nothing because I asked the question in a form that made being wrong survivable.
Last behavioural one. It's 2 a.m. A Sev-1 bridge has nineteen people on it. Four of them are trying different things at once. How do you operate?
The first thing I'd do is find out whether anyone is running the incident, and if nobody is, say so and take it — or hand it to whoever's better placed. Nineteen people with no owner is not a bridge, it's a conference call.
Then, roughly in this order:
   STABILISE        Restore service by the fastest safe
                     route. Not the elegant route. Mitigation
                     is allowed to be ugly.

   ONE OWNER        One incident commander, one scribe.
                     The commander does not debug. The moment
                     they start debugging, nobody is steering.

   PRESERVE         Before restarting anything: grab the
                     logs, the plan, the metrics, the dump if
                     it's warranted. A restart destroys the
                     crime scene and you only get one.

   ONE CHANGE       One change at a time, announced, with
                     a stated expected effect. Four people
                     changing four things means nobody can
                     attribute the outcome to anything.

   TIMELINE         Write down every action and observation
                     with a timestamp, as it happens. Nobody
                     can reconstruct this at 9 a.m. Nobody.

   COMMUNICATE      Regular updates on a fixed cadence, even
                     when the update is "no change, next update
                     in 30 minutes". Silence is interpreted as
                     chaos, and it always costs more than the
                     update would have.

   SPLIT            Mitigation and root cause are separate
                     tracks with separate people. Do not do RCA
                     on a live bridge.

   BLAMELESS        Postmortem on the system, not the person.
                     The person is a symptom of the system that
                     let them do it.

   CONVERT          The postmortem's real output is not a
                     document. It is a detector, an alert, a
                     guardrail, or a product change.
Which of those is hardest?
Preserving evidence, without question. At two in the morning, with a customer down, there is enormous pressure to restart right now — and a restart usually works, and then the evidence is gone and you get to have the exact same incident in three weeks with no more information than you had the first time.
It costs ninety seconds to grab the driver log and a thread dump before you bounce it. I've never once regretted spending that ninety seconds. I have repeatedly regretted not spending it.
The question every senior engineer has an opinion about and very few can answer without describing a job title.
You're interviewing for a staff role. What makes someone staff-level? And don't tell me “scope”.
Radius of impact, which I realise is a synonym for scope, so let me make it concrete instead of abstract.
Take one escalation — the skew one from this morning. Three engineers can work that ticket and all three close it successfully.
The engineer fixes the incident. Job's slow, they find the hot partition, they get it running, customer's happy by morning. That's a good day's work and everybody should be able to do it.
The senior engineer fixes the class. They notice the null-key pattern, fix the pipeline properly, and — this is the part that makes them senior — write it down somewhere the next person will find it, so the next five tickets of this shape close in an hour instead of a day.
The staff engineer changes the system so the class becomes less likely. They ship the key-distribution check into the platform's diagnostics so it fires automatically. They file the product gap: why did a job get four times slower with no signal? They notice that seven customers have the same pattern and go and talk to them before those tickets are filed.
Nobody gets promoted for the restart. But everybody, quietly, depends on the detector.
What if the detector takes three weeks and there are forty tickets in the queue?
Then you don't build it, and that's a real answer rather than a dodge.
Staff-level isn't “always do the systemic thing”. That's how you get an engineer with beautiful tooling and a furious customer. It's knowing which incidents are instances of a class worth spending three weeks on, and which are genuinely one-offs that deserve a fix and a closed ticket.
My rough test is frequency times cost times blindness. How often does this shape appear, what does each instance cost, and — the one people skip — how invisible is it? A cheap failure that nobody can see is often worth more attention than an expensive one that screams, because the screaming one already gets fixed.
Where does influence come into it? You'll have no authority over the engineering teams whose products you'll be criticising.
Which is why the evidence discipline isn't a personality trait, it's the currency.
I can't make a product team do anything. What I can do is show up with a five-minute reproduction, a customer count, a cost figure, and a proposed change that's smaller than they expected. Do that four times and you get a reputation as someone whose tickets are worth reading, and after that you have all the influence you need — not because anyone gave it to you, but because saying no to you is more expensive than saying yes.
The engineers I've seen fail at staff level didn't fail on technical depth. They failed because they arrived with opinions and volume instead of artefacts.
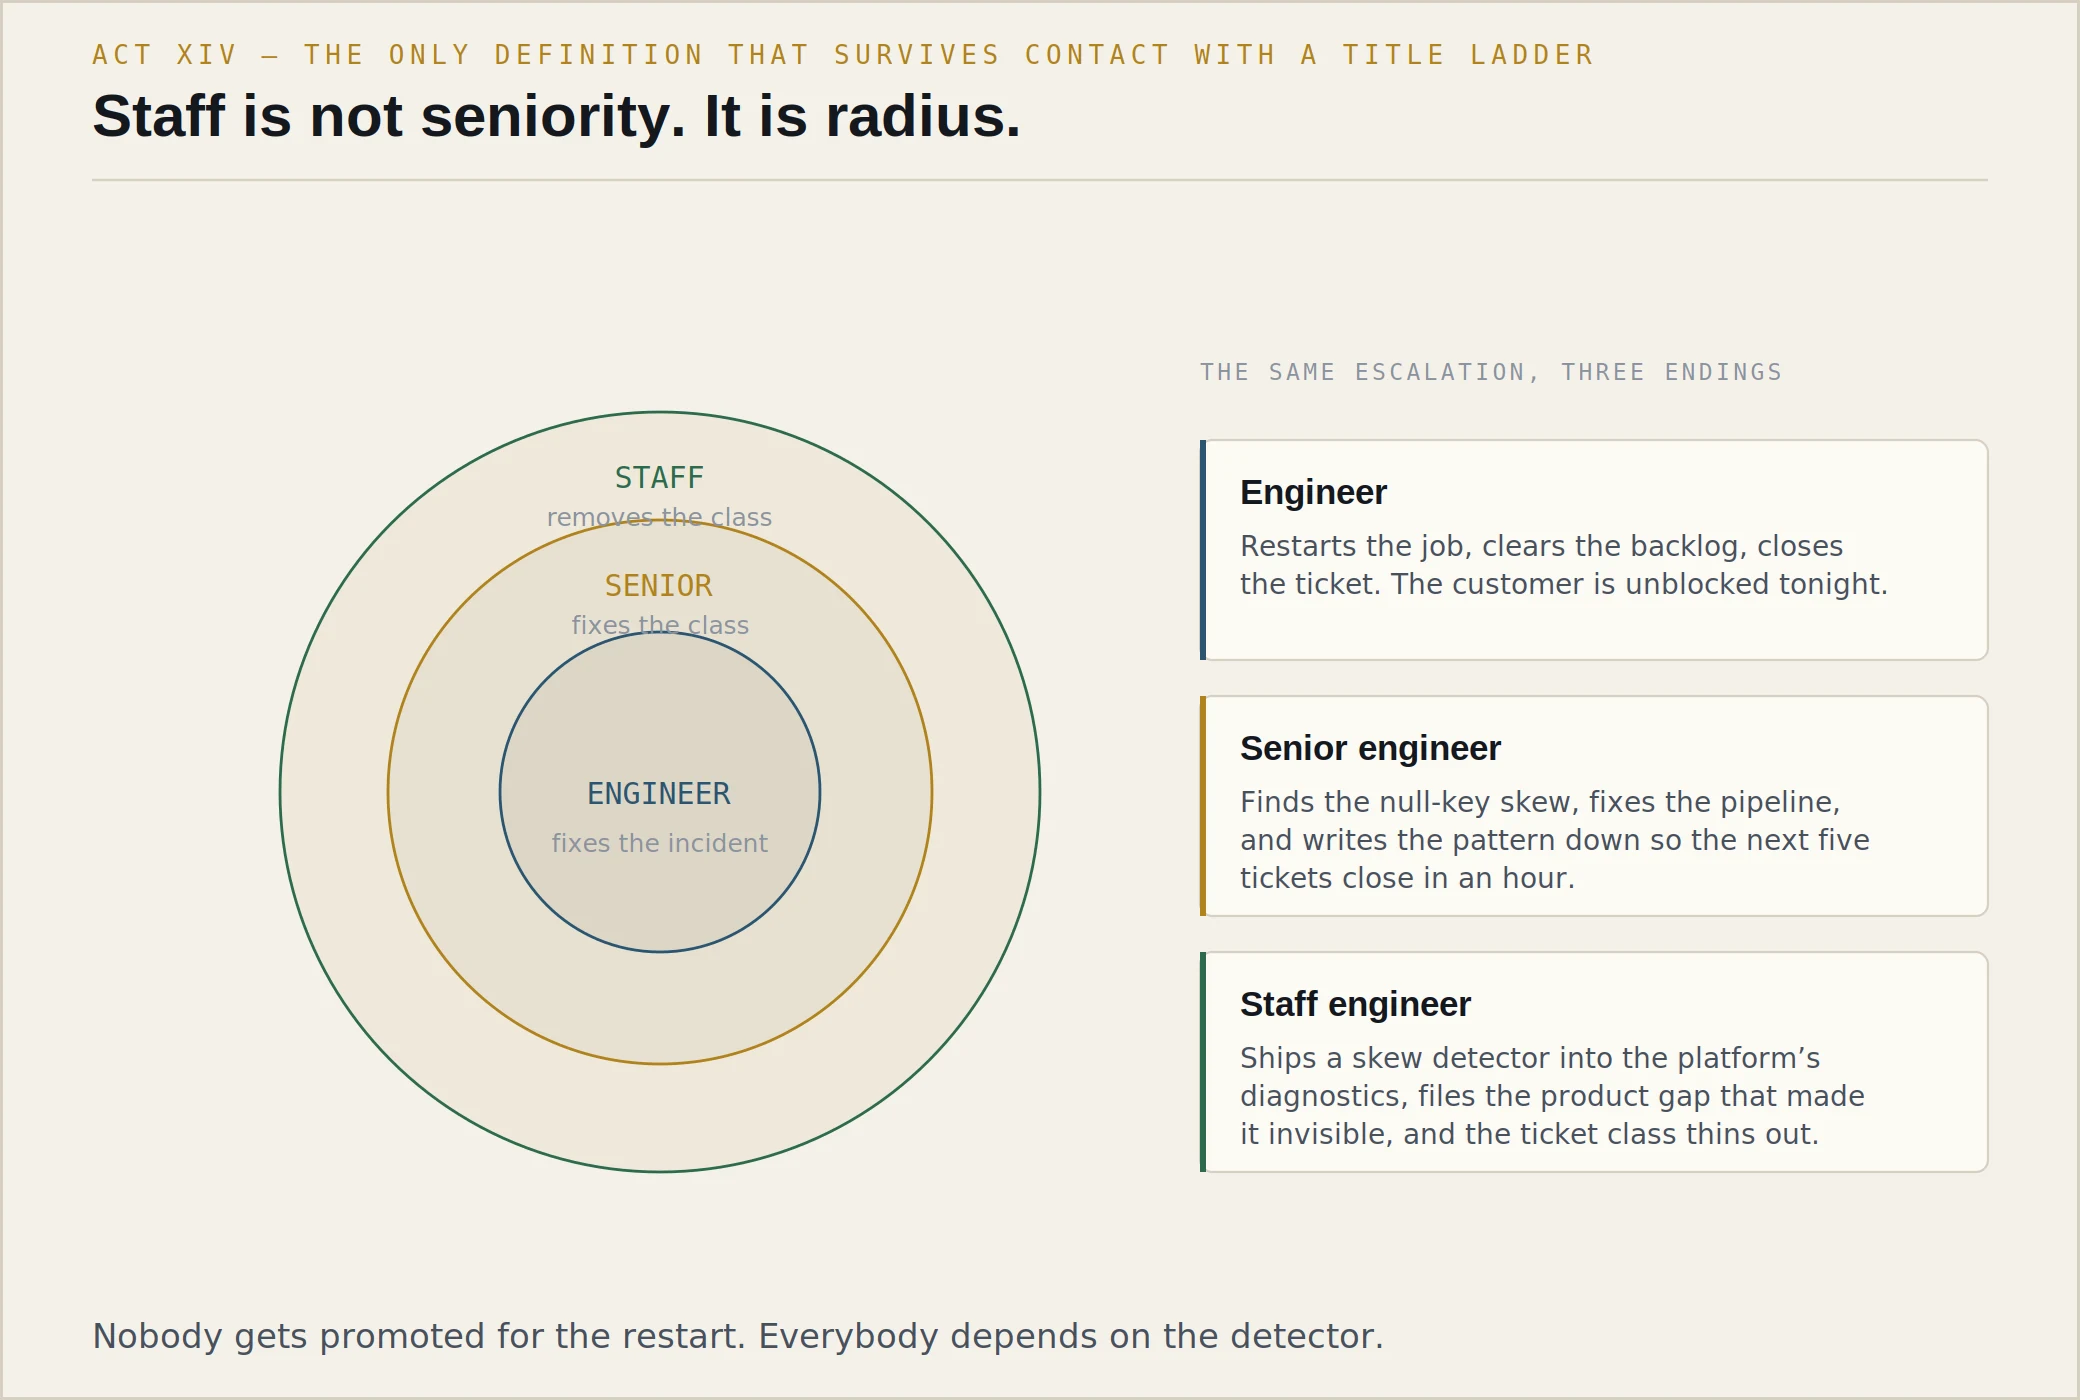
“Staff engineers work on bigger, more complex systems.”
Describes the size of the problem rather than the shape of the contribution. A senior engineer on a huge system is still a senior engineer.
“Staff engineers set technical direction and mentor others.”
The job description read back. Correct, generic, and it will not survive “give me an example”.
Twelve minutes left. The interview has not stopped; the direction has.
We've got about twelve minutes. What questions do you have for me?
Four, and one of them is uncomfortable, so I'll save it.
First: when an escalation reaches your team, where is the biggest diagnostic gap today? Not the biggest product gap — the place where your engineers routinely have to guess because the evidence isn't collectable.
Off-heap memory on containerised executors, easily. We can tell you the heap was fine. We frequently cannot tell you what else was in the container. About a fifth of our hardest cases die there.
That's useful, thank you. Second: how often does an escalation end in a product change, versus an architecture recommendation to the customer?
Roughly one in nine ends in a product change. Most of the rest are the customer's design, and about a third of those we could have prevented with better defaults or better diagnostics — which is the number that keeps me up.
Third: what differentiates your strongest escalation engineer from an excellent support engineer? I want the actual behavioural difference, not the level definition.
The excellent support engineer resolves the case and the customer loves them. The strongest escalation engineer resolves the case and then makes an argument to a product team that the case shouldn't have existed — and can make that argument stick.
The second one is rarer and considerably more annoying to work with.
(laughs) Fourth, and this is the uncomfortable one. How do you measure the problems that don't happen?
If I do this job well, my main output is tickets that never get filed. That's very hard to put in a performance review, and I've watched organisations quietly select against it — you end up rewarding the person who closed two hundred cases over the person who eliminated three hundred.
Honestly? Badly. We track case volume by cause category, so when a category shrinks we can usually point at what shrank it. But if you're asking whether we have a clean metric for prevention — we don't, and I'd be lying if I said otherwise.
What we do have is that I write the promotion cases, and I know the difference. That's a person-dependent answer and you should weigh it as one.
That's a better answer than a metric would have been, actually.
Can I add one more? Where do you see AI-assisted diagnostics helping in this work — and where would you not trust it?
It's excellent at the parts that are search: summarising a thousand-line plan, finding the one anomalous executor across forty logs, spotting that this ticket looks like eleven previous ones. That's real, and it's saving my team hours a week.
Where I don't trust it — and I've been burned — is causal claims. It will tell you confidently that the GC is the root cause, because that sentence appears in ten thousand documents. It has no notion of what it hasn't checked. The most dangerous thing about it in this discipline is that it never says “I haven't proven that yet”.
(a beat) Which is, I suppose, the entire reason we do these interviews.
The pattern: none of them can be answered from a careers page, all of them are about the work rather than the package, and every one of them gives you information you would genuinely use to decide.
“What's the company culture like?”
Unanswerable honestly, so you get a recruiting answer. You have spent one of your questions and learned nothing.
“What does a typical week look like?”
Fine as a fifth question. As a first, it suggests you have not thought about the role beyond its schedule.
“I think you've covered everything.”
After four hours, this reads as either exhaustion or indifference. There is always something you would genuinely like to know; not asking it is a decision the interviewer will notice.
The call has ended. Alex is writing the feedback while it's fresh, which is a discipline they acquired after once writing it three days later and producing four hundred words of nothing.
  RECOMMENDATION: HIRE

  Technical depth        strong
  Evidence discipline    strong — the differentiator
  Customer handling      strong
  Cross-team influence    strong
  Breadth (streaming)    good, not deep. Coachable.

  Notes:

  Got the skew answer, but that isn't why. Candidate refused
  a correct-looking conclusion twice when it hadn't been
  earned, and both times named the discriminating test that
  would settle it. That is the behaviour that makes an
  escalation engineer worth their cost.

  Said "that changes my hypothesis" once, unprompted, and
  "I was wrong" once about their own past work. Neither
  looked rehearsed.

  Conceded the revert to Engineering instantly and won the
  diagnostic instead. Knew which argument they were in.

  Concern: streaming state internals are thinner than the
  rest. Not a blocker — the reasoning was sound even where
  the recall wasn't. Would pair them with S. on the
  streaming rotation for a quarter.

  One line for the panel:
  "Knows the answers. Better: knows which answers
   have not been proven yet."
Twenty-two scenes, six hours of dialogue, one shape underneath all of it.
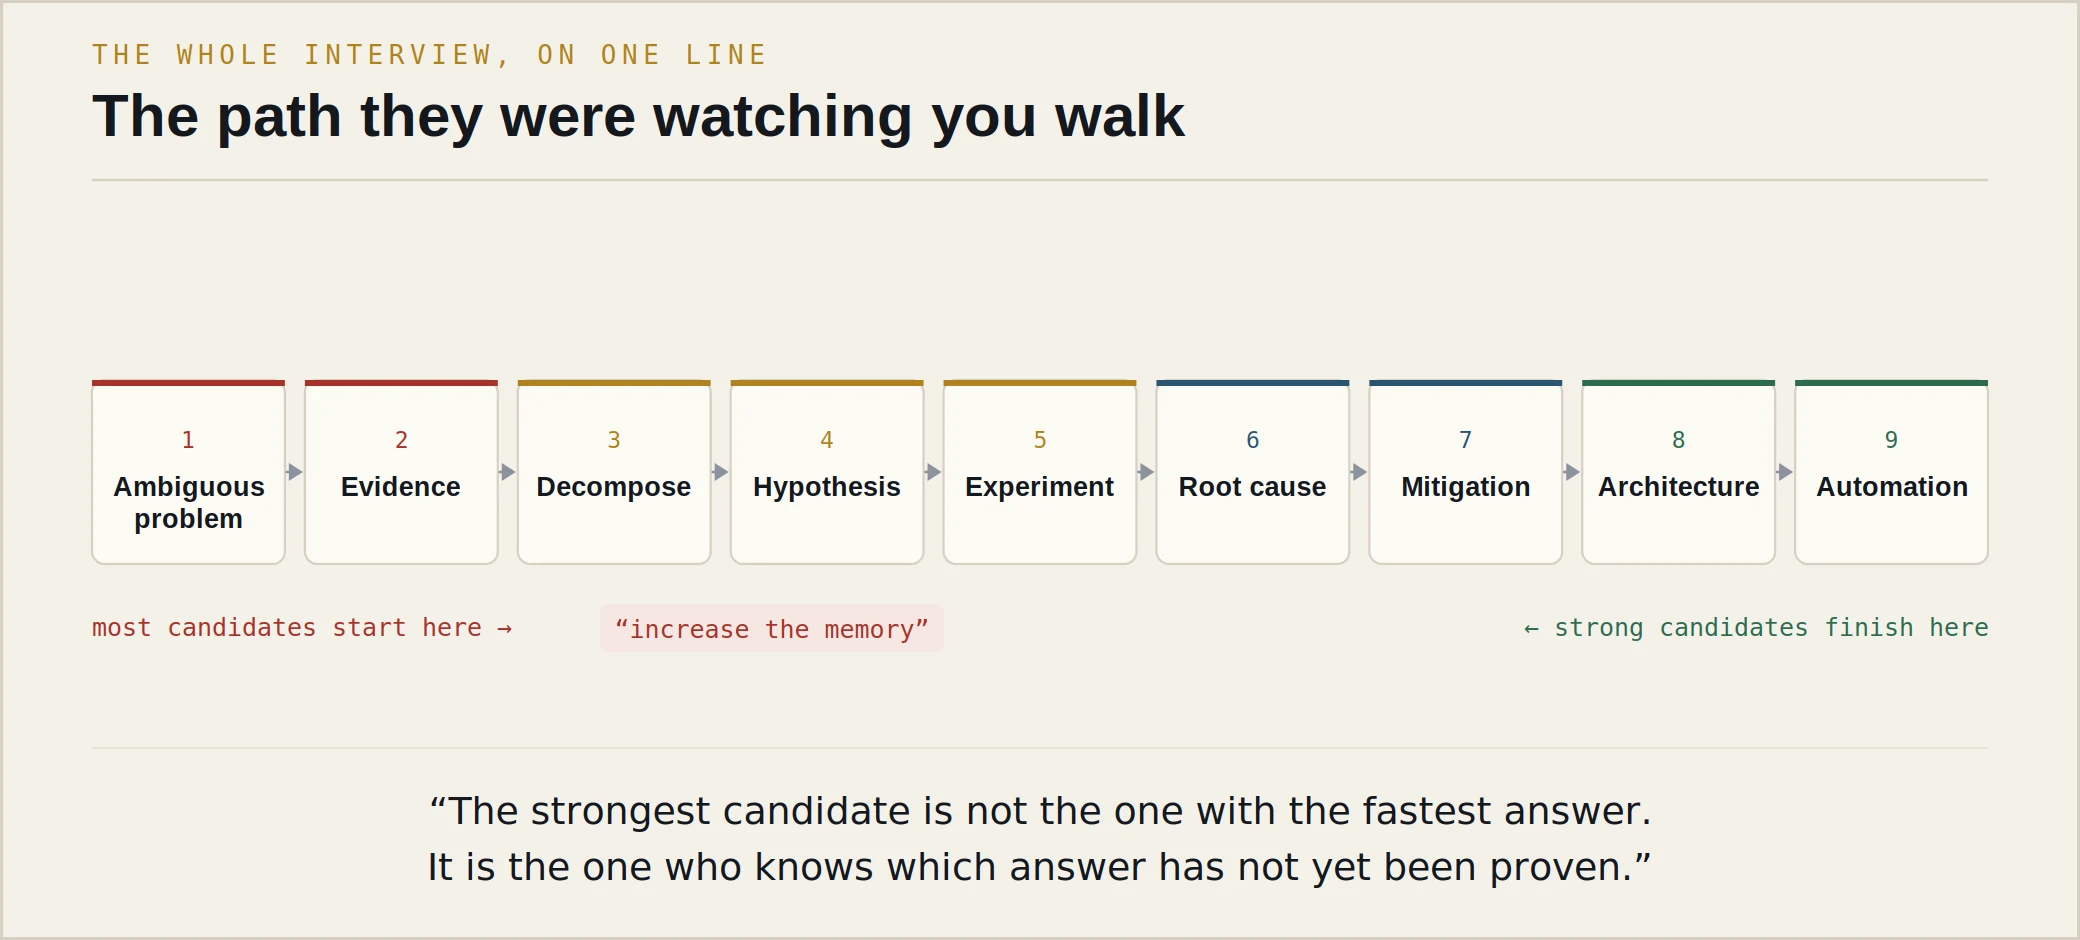
   Ambiguous problem       "the job is slow"
         |
         v
   Evidence                two runs, side by side
         |
         v
   System decomposition    driver / executor / shuffle /
         |                 storage / network / external
         v
   Hypothesis              stated with what would falsify it
         |
         v
   Experiment              one variable, everything else held
         |
         v
   Root cause              the thing that, if removed,
         |                 removes the symptom
         v
   Mitigation              reversible, explainable, tonight
         |
         v
   Architecture change     so this customer stops hitting it
         |
         v
   Automation              so nobody hits it silently again
Notice what is not on that list. Not a single Spark configuration parameter. Not one flag. The whole discipline is a movement from a vague complaint to a proven cause and then outward to something that prevents the next one — and the technical knowledge is the vehicle, not the destination.
This is why senior technical interviews feel unfair to people who prepared by memorising. You can know every join strategy, every AQE setting, every jcmd subcommand, and still fail — because you will confidently name a root cause you have not proven, and the person across from you will have watched that exact confidence cost a customer four days.
And it is why they feel oddly generous to people who have actually done the work. Almost every hard question in this screenplay can be answered honestly with some version of “here is what I'd look at, here is what would change my mind, and here is what I don't know yet.” That is not a trick. It is the job.
Then go and study the reference behind the drama: the Spark Debugging & Performance Handbook covers the same ground as a procedure rather than a story, The Interviewer's Mind takes the other side of the table apart signal by signal, and Mock Interviews has the practice loop to run this script inside.
Fade out
Every incident in this screenplay had an obvious answer available in the first ninety seconds. Increase the memory. Add nodes. Use salting. Delete the checkpoint. Blame the upgrade. Every one of those was reachable without evidence, defensible in a meeting, and wrong often enough to end careers slowly rather than quickly.
The people who are worth hiring for this work are not the ones with the fastest answers. They are the ones who can hold a strong hypothesis loosely, name the test that would kill it, and say the four words that no amount of seniority makes easier: that changes my hypothesis.
The strongest candidate is not the person who produces the fastest answer.
It is the person who knows which answer has not yet been proven.
In production systems, confidence is cheap.
Evidence is engineering.
Northstar Data Platforms, Alex Morgan, Jordan Lee, Halvorsen Group and every incident, metric, log line, ticket and career history in this article are fictional and were created for teaching purposes. Nothing here describes or represents the hiring process, products, defects or people of any real company. The technical scenarios are composites drawn from the general shape of problems that occur in large-scale distributed data systems; they are written to help engineers rehearse reasoning under pressure, not to document any specific real-world incident. Commands, flags and behaviours are illustrative — verify them against the documentation for the version you are actually running.