A Master Narrative on Why Enterprise Data Infrastructure Is Breaking
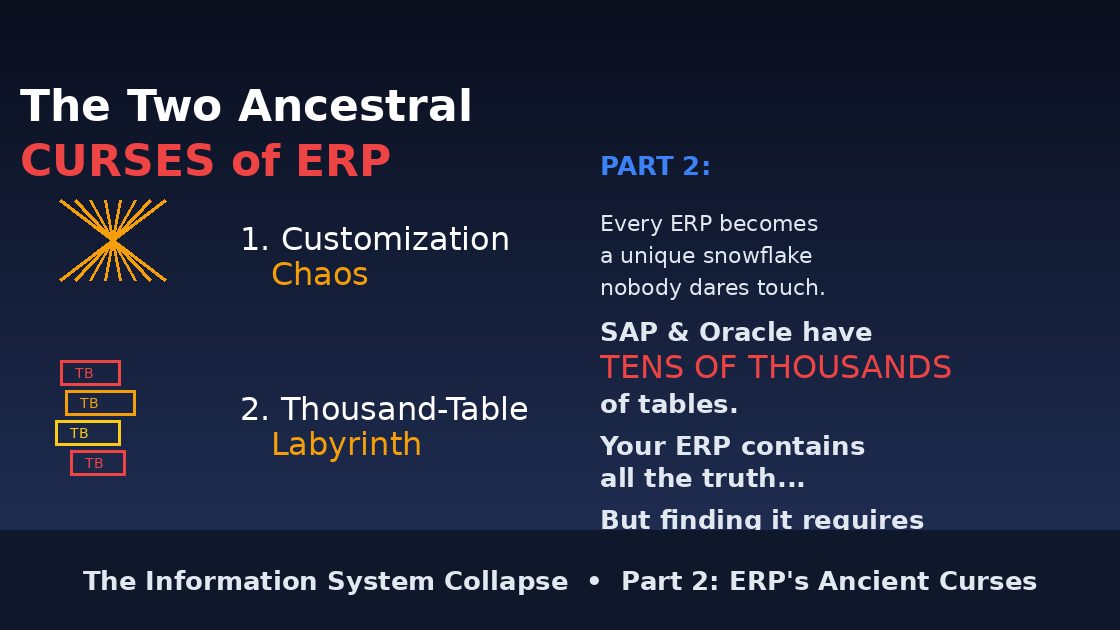
PART I: The Two Ancestral Curses of ERP
The Twin Demons at the Gate
If ERPs were kingdoms, these would be the twin demons guarding the gates — ancient, stubborn, and utterly indifferent to the cries of mortals trying to get work done.
Let's call them out plainly.
1. Customization Chaos: When Every ERP Becomes a Snowflake Nobody Wants to Touch
Every ERP begins life as a clean, dignified temple.
A few months later, it looks like an old agraharam house where every room was extended by someone different, at different times, with no blueprint in sight.
And why?
Because real businesses never fit into the pristine workflows imagined by Oracle, SAP, or Workday's product teams.
So what do companies do?
Add a field here
Build a workflow there
Insert a validation rule somewhere else
Write a dozen custom scripts "just temporarily"
Create extensions for edge cases nobody remembers
The result?
A decade later, your ERP is a glorious Frankenstein.
Upgrading it feels like asking a priest to perform open-heart surgery while chanting mantras and hoping the ancestors approve.
One small customization can break an entire module
One forgotten rule can derail an entire quarter
One consultant can hold your whole company hostage with knowledge they alone possess
It's not evil.
It's just the nature of old systems that were never built for the pace of modern business.
2. The Thousand-Table Labyrinth: Where Data Goes to Hide and Analysts Go to Weep
Now let's talk about the beast in the basement.
ERPs don't store information — they bury it like ancient kings bury treasure.
You want revenue recognition data?
Prepare to navigate:
General ledger tables
Subledger tables
Adjustment tables
Accrual tables
Recognition schedules
Reference tables
Historical audit tables
Interface tables
Workflow tables
And that one table named something like whose purpose nobody remembers...
And this is not exaggeration — SAP and Oracle literally have tens of thousands of tables.
Each table has:
Cryptic field names
Partial documentation (if you're lucky)
Joins that require a PhD in arcane database design
Logic buried in stored procedures nobody dares touch
Triggers that fire in mysterious sequences
Calculated fields whose formulas exist only in consultant notes from 2014
The tragic reality:
Your ERP contains all the truth about your business.
But finding that truth requires:
3 consultants
5 days
12 table joins
47 WHERE clauses
1 very expensive Oracle license
And a prayer to whatever god watches over SQL queries
This is why data teams exist.
Not to analyze.
To excavate.
PART II: The Eleven Plagues of Modern Data & Analytics
These are the universal agonies felt by data engineers, analysts, BI teams, and business users alike — but rarely articulated clearly.
1. Fragile ETL Pipelines That Break Weekly
ERP changes → break pipelines CRM changes → break pipelines Vendor pushes patch → break pipelines Finance changes definition → break pipelines
Every system update becomes a minor festival of suffering.
Your data team's Slack is just an endless stream of:
"Pipeline failed again"
"Re-running the job"
"Who changed the schema?"
"Can someone restart the DAG?"
2. SQL Overload & Semantic Chaos
Everyone has their own version of:
revenue
invoice
customer
churn
margin
cost center
Meaning lives in spreadsheets, tribal memory, and Slack threads.
SQL becomes the battlefield for competing definitions.
Finance calculates revenue one way. Sales calculates it another way. Product calculates it a third way.
All three are "correct" for their purposes. None match each other.
3. Dashboard Overgrowth (Dashboard Hell)
Enterprises have:
1,200 dashboards
20% maintained
< 10% actually used
0% trusted universally
Most dashboards contradict each other. The rest confuse more than they clarify.
Every new executive demands their own dashboard. Every department builds their own views. Every analyst creates "one more version."
Nobody deletes anything.
So you end up with:
"Revenue Dashboard v1"
"Revenue Dashboard v2 FINAL"
"Revenue Dashboard v2 FINAL FINAL"
"Revenue Dashboard Q3 2024"
"ACTUAL Revenue Dashboard USE THIS ONE"
And they all show different numbers.
4. Slow Time-to-Insight
The Modern Business Query Tragedy (A Play in 8 Acts):
Day 1, 9am: Stakeholder asks: "Why did conversion drop yesterday?"
Day 1, 10am: Analyst starts gathering tables
Day 1, 2pm: Writes SQL query
Day 1, 2:20pm: Query runs for 20 minutes
Day 1, 2:40pm: Results don't match expected numbers
Day 1, 3pm: Fixes join, re-runs query
Day 1, 3:20pm: Still doesn't match
Day 1, 4pm: Tries another data source
Day 2, 10am: Schedules meeting to explain findings
Day 3, 9am: Finally presents answer
Day 3, 9:05am: Stakeholder: "Never mind, we already made the decision"
The business has moved on by then.
5. Pipeline + Model Ownership Confusion
Who owns the truth?
Data engineering?
Analytics engineering?
BI?
Finance?
Product?
ERP admin?
Accountability is spread so thin it evaporates.
When something breaks, everyone points at everyone else:
"That's a data engineering problem"
"No, that's analytics engineering"
"Actually, Finance owns that definition"
"But Product changed the tracking"
"And ERP admin updated the field"
By the time blame is assigned, the problem has cost the company $50K.
6. Missing Real-Time Visibility
The data flow:
By the time you see the data, the opportunity is already gone.
7. Technical Debt That Grows Faster Than Revenue
Models build on old models. ETL grows new layers like tree rings. Dashboards multiply like stray kittens.
Nobody deletes anything.
Why? Because nobody knows what's safe to delete.
That dashboard from 2018? Maybe someone still uses it. That dbt model marked "legacy"? Probably feeds something important. That ETL job that fails weekly? Someone might notice if we remove it.
One day, the entire system becomes unmaintainable.
You've seen this moment:
The senior data engineer announces they're leaving. Everyone panics. Because they're the only one who understands the pipeline.
8. Overreliance on Human Glue
Analysts spend more time:
Reconciling numbers between systems
Explaining why definitions differ
Re-running failed reports
Communicating pipeline dependencies
Attending meetings about data quality
Building "one-off" reports that become permanent
Playing telephone between business and engineering
...than actually analyzing anything.
They are translators, not analysts. Archaeologists, not strategists. Plumbers, not advisors.
This is why good analysts quit.
They didn't spend 4 years studying statistics to spend their days explaining why two dashboards don't match.
9. Unpredictable Query Performance
Query time depends on:
Warehouse load (who else is running queries?)
Cluster size (did someone shut down the large cluster to save costs?)
Join complexity (how many tables are we hitting?)
Materialized view freshness (when did it last update?)
Partition pruning (did you remember to filter by date?)
Random cloud provider issues
Luck
"Come back in 20 minutes" becomes a lifestyle.
Sometimes a query takes 30 seconds. Sometimes it takes 30 minutes. Same query. Same data.
Why?
Nobody knows.
10. Low Trust Across the Organization
Different dashboards show different truths. Different analysts produce different answers. Different teams run different pipelines. Different departments track different KPIs.
Analytics becomes a political battlefield.
The worst meeting in any company:
Finance says revenue is $2.1M
Sales says revenue is $2.3M
Product says revenue is $1.9M
Everyone's data comes from "the warehouse." Everyone's SQL looks correct. Everyone is using the "official" definitions.
And yet...
Nobody trusts the data.
So executives make decisions based on gut feeling instead.
Which makes you wonder: why are we spending $3M/year on data infrastructure?
11. Lack of Causality & Explanation
Dashboards show: "Revenue dropped 12% yesterday."
But they don't tell you why.
To answer "why," you need:
ERP has the financial detail
CRM has the customer context
WMS has the fulfillment events
Product logs have the user behavior
Marketing platform has the campaign data
Support system has the complaint history
But nobody connects them automatically.
So the analyst manually:
Exports from 6 systems
Joins in Excel or Python
Looks for correlations
Forms hypotheses
Tests them one by one
Takes 3 days
By which time the CEO has already sent an angry Slack message to the entire company.
PART III: The Root Cause — Why ERP + ETL + Warehouse Architecture Fails
The combined architecture is not bad — it is simply not built for the world we now live in.
Read this as the "grand unifying theory" of enterprise suffering.
The Three-Headed Monster
Most enterprises run this architecture:
This architecture fails for structural reasons, not because teams are incompetent.
Let's break down why each part poisons the next:
Stage 1: ERPs Produce Rigid, Complex, Multi-Table Data
ERP data is designed for:
Correctness (double-entry bookkeeping)
Auditability (regulatory compliance)
Compliance (SOX, GAAP, IFRS)
Monthly accounting cycles
It is NOT designed for:
Analytics
Context
Explanation
Speed
Clarity
ERP data characteristics:
Hard to understand (cryptic table names)
Split across hundreds of tables (normalization hell)
"Event-poor" (no full behavioral history)
Often delayed or batch-based (not real-time)
Logic buried in triggers/procedures (invisible to analysts)
This creates the first problem: Data is correct but incomprehensible.
Stage 2: ETL Has to "Translate" the ERP's Language Into Something Useful
ETL is required because ERP data is not:
Joinable (without 12-table joins)
Contextual (just states, no transitions)
Normalized for analytics (normalized for accounting)
Time-ordered (dates scattered across tables)
Easy to interpret (field names like )
ETL becomes the world's most expensive translator.
But ETL pipelines inherit ERP's flaws:
Fragile (one schema change breaks everything)
Complex (spaghetti dependencies)
High-maintenance (breaks weekly)
Slow (batch processing)
Dependent on tribal knowledge (only Sarah knows how it works)
And ETL introduces new flaws:
Latency (hours or days behind)
Duplicates (deduplication logic fails)
Occasional corruption (data quality issues)
Mismatched definitions (business rules drift)
Version drift (staging vs production differences)
This creates the second problem: Translation introduces delay and errors.
Stage 3: Warehouses Must Reconstruct Truth From Fragmented ERP Data
Warehouses receive "post-processed" truth. Not the actual truth.
This creates:
Semantic drift (definitions change over time)
Multiple sources of truth (different marts for different teams)
Massive storage bills ($500K/year growing 40%)
Endless dbt model layers (models building on models)
Dashboards that contradict each other
Definitions that change every quarter
Warehouses cannot fix the underlying inconsistencies. They simply store them more neatly.
The warehouse is a beautifully organized graveyard of partially correct data.
This creates the third problem: We've organized confusion, not eliminated it.
Stage 4: BI Tools Are Blind Without Event Context
BI tools can slice numbers — but they cannot tell stories.
Why?
Because they receive:
Facts without narrative
Tables without timeline
Metrics without meaning
States without transitions
Numbers without context
BI can tell you what happened. It cannot tell you why it happened.
Not because BI is bad — but because ERP → ETL → Warehouse produces flattened, decontextualized data.
When a dashboard shows "Conversion dropped 15%," it cannot answer:
What events preceded the drop?
Which customer segments were affected?
What system changes occurred?
What external factors influenced it?
What correlations exist across systems?
This creates the fourth problem: Visibility without understanding.
Stage 5: Analytics Teams Become Human Middleware
Analysts spend most of their time:
Interpreting ERP tables (archaeology)
Stitching warehouse tables (plumbing)
Explaining KPI definitions (translation)
Reconciling mismatches (detective work)
Translating business questions into SQL (interpretation)
Backtracking pipeline failures (firefighting)
They become the living glue holding a dead architecture upright.
This is why:
Good analysts leave
Technical debt accumulates
Tribal knowledge concentrates
Innovation stalls
Morale collapses
This creates the fifth problem: Humans compensating for architectural failure.
Stage 6: The Combined Loop Is Too Slow for Modern Business
This is a multi-day loop.
But modern business cycles require:
Second-by-second detection (fraud, outages, drops)
Real-time alerts (cart abandonment, churn signals)
Instant root-cause analysis (why did X happen?)
Predictive recommendations (what will happen next?)
Automated actions (intervene before it's too late)
The old loop is simply not fast enough.
By the time you see the problem, three things have happened:
Your competitor already fixed it
Your customer already churned
Your opportunity already closed
This creates the sixth problem: Structural latency killing competitive advantage.
The Final Truth: Why This Architecture Is Fundamentally Broken
ERP + ETL + Warehouse Fails Because They Treat Data as a Static Ledger, Not a Live Story.
ERP stores the past
ETL cleans the past
Warehouse aggregates the past
BI visualizes the past
Analytics explains the past
Nobody sees what is happening now. Nobody knows why it is happening. Nobody acts before it's too late.
The Three Fatal Assumptions
The entire modern data stack rests on three assumptions that are no longer true:
Assumption 1: "Data Can Be Moved and Stored Centrally"
When this was true: 1990s-2010s Data volumes were manageable. Moving data was feasible.
Why it's false now: 2025+ Data grows 100% per year. Moving it all costs millions. Latency is unacceptable.
Assumption 2: "Business Questions Can Wait for Batch Processing"
When this was true: When business cycles were monthly/quarterly Decision-making was slower. Waiting days for answers was acceptable.
Why it's false now: When competitors make decisions in real-time Speed is competitive advantage. Waiting = losing.
Assumption 3: "Humans Can Translate Business Questions Into Data Queries"
When this was true: When questions were simple and data was structured "Show me Q3 revenue by region" → straightforward SQL
Why it's false now: When questions require synthesis across systems "Why are high-value customers churning in the West region?" → requires joining 7 systems, understanding causality, and synthesizing narrative
What Comes Next
The collapse isn't coming. It's underway.
You're feeling it right now:
Pipelines breaking more frequently
Analysts overwhelmed
Trust eroding
Costs escalating
Speed declining
The architecture that served us for 30 years has reached its breaking point.
The question isn't "Will this happen?"
The question is: "What do we build next?"
The New Architecture: Event-Driven, Conversational, Real-Time
Instead of:
We need:
What changes:
Events instead of States Capture what happens, not just final states Preserve full context and causality Enable real-time detection
Semantic Understanding instead of Schema Knowledge Natural language queries, not SQL System understands intent No need to know table structures
Synthesis instead of Visualization Answers with explanations, not just charts "Why" built-in, not bolted-on Actionable recommendations included
Real-Time instead of Batch Act on what's happening now Intervene before it's too late Compete on speed
Domain Intelligence instead of Generic Tools Specialized reasoning for each domain Business logic embedded Context maintained
The Path Forward
You don't rip out the old system.
You build the new one alongside it.
You prove it works.
You migrate gradually.
You survive the transition.
Because the collapse is coming.
And the only question that matters is:
"Will you be ready?"